Read This Before You Buy ProCredit Holding AG & Co. KGaA (ETR:PCZ) Because Of Its P/E Ratio

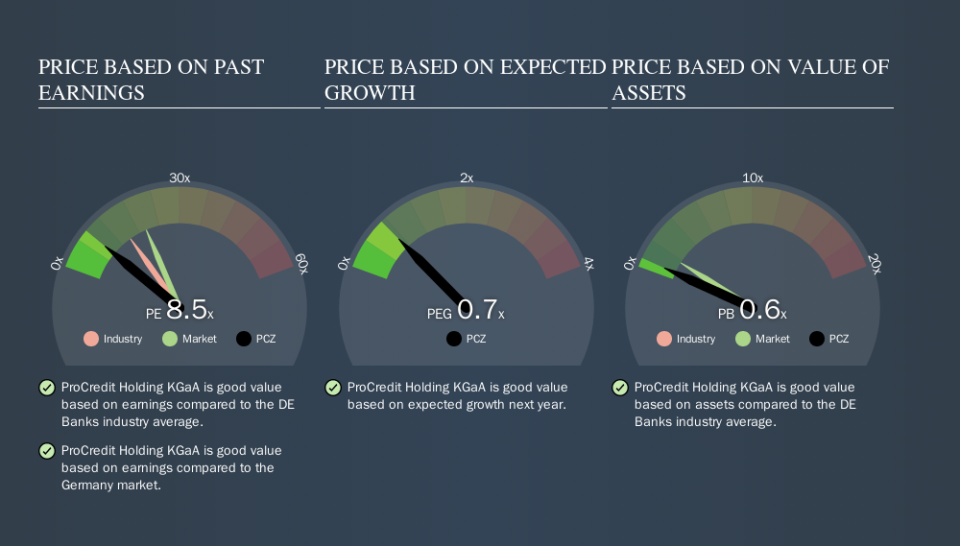
This article is written for those who want to get better at using price to earnings ratios (P/E ratios). We'll show how you can use ProCredit Holding AG & Co. KGaA's (ETR:PCZ) P/E ratio to inform your assessment of the investment opportunity. ProCredit Holding KGaA has a price to earnings ratio of 8.47, based on the last twelve months. That corresponds to an earnings yield of approximately 12%.
View our latest analysis for ProCredit Holding KGaA
How Do You Calculate A P/E Ratio?
The formula for price to earnings is:
Price to Earnings Ratio = Price per Share ÷ Earnings per Share (EPS)
Or for ProCredit Holding KGaA:
P/E of 8.47 = €7.6 ÷ €0.90 (Based on the year to June 2019.)
Is A High P/E Ratio Good?
A higher P/E ratio means that investors are paying a higher price for each €1 of company earnings. That is not a good or a bad thing per se, but a high P/E does imply buyers are optimistic about the future.
How Does ProCredit Holding KGaA's P/E Ratio Compare To Its Peers?
We can get an indication of market expectations by looking at the P/E ratio. The image below shows that ProCredit Holding KGaA has a lower P/E than the average (15.3) P/E for companies in the banks industry.
This suggests that market participants think ProCredit Holding KGaA will underperform other companies in its industry. While current expectations are low, the stock could be undervalued if the situation is better than the market assumes. If you consider the stock interesting, further research is recommended. For example, I often monitor director buying and selling.
How Growth Rates Impact P/E Ratios
P/E ratios primarily reflect market expectations around earnings growth rates. That's because companies that grow earnings per share quickly will rapidly increase the 'E' in the equation. That means unless the share price increases, the P/E will reduce in a few years. So while a stock may look expensive based on past earnings, it could be cheap based on future earnings.
ProCredit Holding KGaA saw earnings per share decrease by 7.0% last year. But over the longer term (3 years), earnings per share have increased by 5.3%.
A Limitation: P/E Ratios Ignore Debt and Cash In The Bank
The 'Price' in P/E reflects the market capitalization of the company. Thus, the metric does not reflect cash or debt held by the company. The exact same company would hypothetically deserve a higher P/E ratio if it had a strong balance sheet, than if it had a weak one with lots of debt, because a cashed up company can spend on growth.
Spending on growth might be good or bad a few years later, but the point is that the P/E ratio does not account for the option (or lack thereof).
ProCredit Holding KGaA's Balance Sheet
Net debt totals a substantial 136% of ProCredit Holding KGaA's market cap. This level of debt justifies a relatively low P/E, so remain cognizant of the debt, if you're comparing it to other stocks.
The Bottom Line On ProCredit Holding KGaA's P/E Ratio
ProCredit Holding KGaA trades on a P/E ratio of 8.5, which is below the DE market average of 20.1. The P/E reflects market pessimism that probably arises from the lack of recent EPS growth, paired with significant leverage.
Investors have an opportunity when market expectations about a stock are wrong. As value investor Benjamin Graham famously said, 'In the short run, the market is a voting machine but in the long run, it is a weighing machine.' So this free visualization of the analyst consensus on future earnings could help you make the right decision about whether to buy, sell, or hold.
You might be able to find a better buy than ProCredit Holding KGaA. If you want a selection of possible winners, check out this free list of interesting companies that trade on a P/E below 20 (but have proven they can grow earnings).
We aim to bring you long-term focused research analysis driven by fundamental data. Note that our analysis may not factor in the latest price-sensitive company announcements or qualitative material.
If you spot an error that warrants correction, please contact the editor at editorial-team@simplywallst.com. This article by Simply Wall St is general in nature. It does not constitute a recommendation to buy or sell any stock, and does not take account of your objectives, or your financial situation. Simply Wall St has no position in the stocks mentioned. Thank you for reading.
