Read This Before You Buy Virtu Financial, Inc. (NASDAQ:VIRT) Because Of Its P/E Ratio

Want to participate in a short research study? Help shape the future of investing tools and you could win a $250 gift card!
The goal of this article is to teach you how to use price to earnings ratios (P/E ratios). We'll show how you can use Virtu Financial, Inc.'s (NASDAQ:VIRT) P/E ratio to inform your assessment of the investment opportunity. What is Virtu Financial's P/E ratio? Well, based on the last twelve months it is 21.96. That corresponds to an earnings yield of approximately 4.6%.
Check out our latest analysis for Virtu Financial
How Do I Calculate A Price To Earnings Ratio?
The formula for P/E is:
Price to Earnings Ratio = Share Price ÷ Earnings per Share (EPS)
Or for Virtu Financial:
P/E of 21.96 = $22.03 ÷ $1 (Based on the year to March 2019.)
Is A High P/E Ratio Good?
A higher P/E ratio implies that investors pay a higher price for the earning power of the business. That is not a good or a bad thing per se, but a high P/E does imply buyers are optimistic about the future.
How Growth Rates Impact P/E Ratios
P/E ratios primarily reflect market expectations around earnings growth rates. When earnings grow, the 'E' increases, over time. And in that case, the P/E ratio itself will drop rather quickly. And as that P/E ratio drops, the company will look cheap, unless its share price increases.
Virtu Financial saw earnings per share decrease by 55% last year. But it has grown its earnings per share by 5.2% per year over the last three years. And over the longer term (5 years) earnings per share have decreased 11% annually. This could justify a pessimistic P/E.
Does Virtu Financial Have A Relatively High Or Low P/E For Its Industry?
The P/E ratio essentially measures market expectations of a company. The image below shows that Virtu Financial has a lower P/E than the average (35.8) P/E for companies in the capital markets industry.
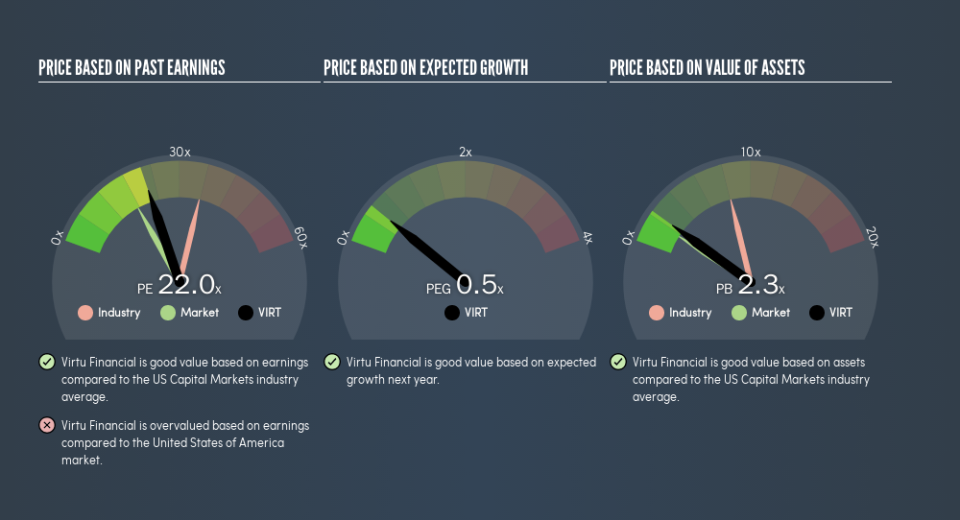
This suggests that market participants think Virtu Financial will underperform other companies in its industry. While current expectations are low, the stock could be undervalued if the situation is better than the market assumes. You should delve deeper. I like to check if company insiders have been buying or selling.
A Limitation: P/E Ratios Ignore Debt and Cash In The Bank
The 'Price' in P/E reflects the market capitalization of the company. Thus, the metric does not reflect cash or debt held by the company. Hypothetically, a company could reduce its future P/E ratio by spending its cash (or taking on debt) to achieve higher earnings.
Spending on growth might be good or bad a few years later, but the point is that the P/E ratio does not account for the option (or lack thereof).
Is Debt Impacting Virtu Financial's P/E?
With net cash of US$1.8b, Virtu Financial has a very strong balance sheet, which may be important for its business. Having said that, at 42% of its market capitalization the cash hoard would contribute towards a higher P/E ratio.
The Verdict On Virtu Financial's P/E Ratio
Virtu Financial's P/E is 22 which is above average (17.5) in the US market. The recent drop in earnings per share might keep value investors away, but the relatively strong balance sheet will allow the company time to invest in growth. Clearly, the high P/E indicates shareholders think it will!
Investors have an opportunity when market expectations about a stock are wrong. If the reality for a company is better than it expects, you can make money by buying and holding for the long term. So this free report on the analyst consensus forecasts could help you make a master move on this stock.
You might be able to find a better buy than Virtu Financial. If you want a selection of possible winners, check out this free list of interesting companies that trade on a P/E below 20 (but have proven they can grow earnings).
We aim to bring you long-term focused research analysis driven by fundamental data. Note that our analysis may not factor in the latest price-sensitive company announcements or qualitative material.
If you spot an error that warrants correction, please contact the editor at editorial-team@simplywallst.com. This article by Simply Wall St is general in nature. It does not constitute a recommendation to buy or sell any stock, and does not take account of your objectives, or your financial situation. Simply Wall St has no position in the stocks mentioned. Thank you for reading.
