What Can We Make Of Rectifier Technologies Limited’s (ASX:RFT) High Return On Capital?

Today we'll look at Rectifier Technologies Limited (ASX:RFT) and reflect on its potential as an investment. In particular, we'll consider its Return On Capital Employed (ROCE), as that can give us insight into how profitably the company is able to employ capital in its business.
Firstly, we'll go over how we calculate ROCE. Next, we'll compare it to others in its industry. And finally, we'll look at how its current liabilities are impacting its ROCE.
What is Return On Capital Employed (ROCE)?
ROCE measures the 'return' (pre-tax profit) a company generates from capital employed in its business. In general, businesses with a higher ROCE are usually better quality. In brief, it is a useful tool, but it is not without drawbacks. Author Edwin Whiting says to be careful when comparing the ROCE of different businesses, since 'No two businesses are exactly alike.
So, How Do We Calculate ROCE?
The formula for calculating the return on capital employed is:
Return on Capital Employed = Earnings Before Interest and Tax (EBIT) ÷ (Total Assets - Current Liabilities)
Or for Rectifier Technologies:
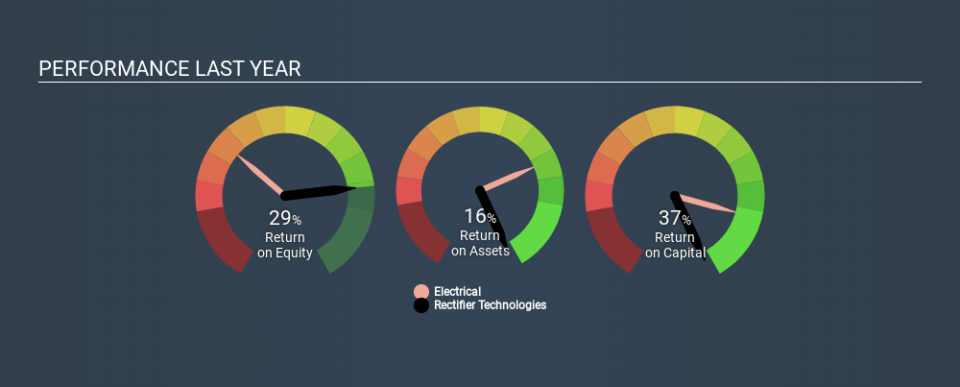
0.37 = AU$3.5m ÷ (AU$14m - AU$4.8m) (Based on the trailing twelve months to June 2019.)
So, Rectifier Technologies has an ROCE of 37%.
View our latest analysis for Rectifier Technologies
Does Rectifier Technologies Have A Good ROCE?
One way to assess ROCE is to compare similar companies. Using our data, we find that Rectifier Technologies's ROCE is meaningfully better than the 15% average in the Electrical industry. I think that's good to see, since it implies the company is better than other companies at making the most of its capital. Setting aside the comparison to its industry for a moment, Rectifier Technologies's ROCE in absolute terms currently looks quite high.
We can see that, Rectifier Technologies currently has an ROCE of 37% compared to its ROCE 3 years ago, which was 25%. This makes us wonder if the company is improving. You can click on the image below to see (in greater detail) how Rectifier Technologies's past growth compares to other companies.
It is important to remember that ROCE shows past performance, and is not necessarily predictive. Companies in cyclical industries can be difficult to understand using ROCE, as returns typically look high during boom times, and low during busts. ROCE is only a point-in-time measure. You can check if Rectifier Technologies has cyclical profits by looking at this free graph of past earnings, revenue and cash flow.
Do Rectifier Technologies's Current Liabilities Skew Its ROCE?
Short term (or current) liabilities, are things like supplier invoices, overdrafts, or tax bills that need to be paid within 12 months. The ROCE equation subtracts current liabilities from capital employed, so a company with a lot of current liabilities appears to have less capital employed, and a higher ROCE than otherwise. To counter this, investors can check if a company has high current liabilities relative to total assets.
Rectifier Technologies has total assets of AU$14m and current liabilities of AU$4.8m. Therefore its current liabilities are equivalent to approximately 34% of its total assets. Rectifier Technologies has a medium level of current liabilities, boosting its ROCE somewhat.
Our Take On Rectifier Technologies's ROCE
Still, it has a high ROCE, and may be an interesting prospect for further research. Rectifier Technologies looks strong on this analysis, but there are plenty of other companies that could be a good opportunity . Here is a free list of companies growing earnings rapidly.
I will like Rectifier Technologies better if I see some big insider buys. While we wait, check out this free list of growing companies with considerable, recent, insider buying.
If you spot an error that warrants correction, please contact the editor at editorial-team@simplywallst.com. This article by Simply Wall St is general in nature. It does not constitute a recommendation to buy or sell any stock, and does not take account of your objectives, or your financial situation. Simply Wall St has no position in the stocks mentioned.
We aim to bring you long-term focused research analysis driven by fundamental data. Note that our analysis may not factor in the latest price-sensitive company announcements or qualitative material. Thank you for reading.
