With An ROE Of 0.41%, Has Metro Bank PLC’s (LSE:MTRO) Management Done A Good Job?

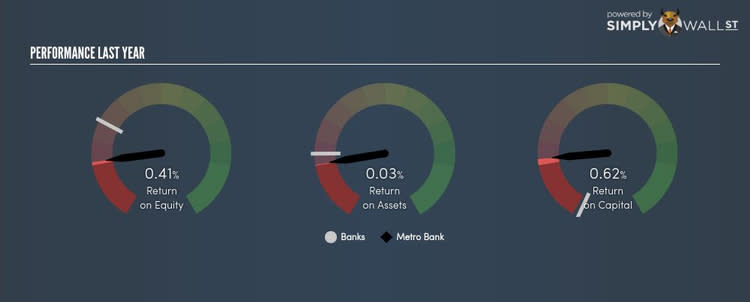
Metro Bank PLC’s (LSE:MTRO) most recent return on equity was a substandard 0.41% relative to its industry performance of 6.10% over the past year. An investor may attribute an inferior ROE to a relatively inefficient performance, and whilst this can often be the case, knowing the nuts and bolts of the ROE calculation may change that perspective and give you a deeper insight into MTRO's past performance. Today I will look at how components such as financial leverage can influence ROE which may impact the sustainability of MTRO's returns. Check out our latest analysis for Metro Bank
Breaking down Return on Equity
Return on Equity (ROE) weighs MTRO’s profit against the level of its shareholders’ equity. An ROE of 0.41% implies £0 returned on every £1 invested. While a higher ROE is preferred in most cases, there are several other factors we should consider before drawing any conclusions.
Return on Equity = Net Profit ÷ Shareholders Equity
ROE is assessed against cost of equity, which is measured using the Capital Asset Pricing Model (CAPM) – but let’s not dive into the details of that today. For now, let’s just look at the cost of equity number for MTRO, which is 9.00%. Given a discrepancy of -8.58% between return and cost, this indicated that MTRO may be paying more for its capital than what it’s generating in return. ROE can be dissected into three distinct ratios: net profit margin, asset turnover, and financial leverage. This is called the Dupont Formula:
Dupont Formula
ROE = profit margin × asset turnover × financial leverage
ROE = (annual net profit ÷ sales) × (sales ÷ assets) × (assets ÷ shareholders’ equity)
ROE = annual net profit ÷ shareholders’ equity
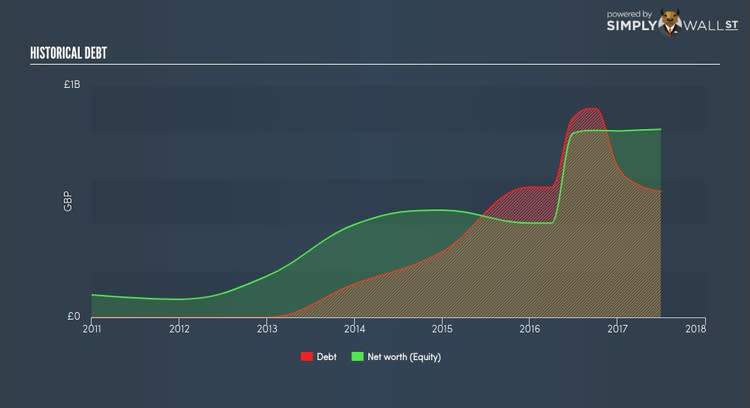
The first component is profit margin, which measures how much of sales is retained after the company pays for all its expenses. The other component, asset turnover, illustrates how much revenue MTRO can make from its asset base. The most interesting ratio, and reflective of sustainability of its ROE, is financial leverage. Since ROE can be inflated by excessive debt, we need to examine MTRO’s debt-to-equity level. Currently the debt-to-equity ratio stands at a reasonable 66.97%, which means its ROE is driven by its ability to grow its profit without a significant debt burden.
What this means for you:
Are you a shareholder? MTRO’s below-industry ROE is disappointing, furthermore, its returns were not even high enough to cover its own cost of equity. Since its existing ROE is not fuelled by unsustainable debt, investors shouldn’t give up as MTRO still has capacity to improve shareholder returns by borrowing to invest in new projects in the future.
Are you a potential investor? If you are considering investing in MTRO, basing your decision on ROE alone is certainly not sufficient. I recommend you do additional fundamental analysis by looking through our most recent infographic report on Metro Bank to help you make a more informed investment decision. If you are not interested in MTRO anymore, you can use our free platform to see our list of stocks with Return on Equity over 20%.
To help readers see pass the short term volatility of the financial market, we aim to bring you a long-term focused research analysis purely driven by fundamental data. Note that our analysis does not factor in the latest price sensitive company announcements.
The author is an independent contributor and at the time of publication had no position in the stocks mentioned.
