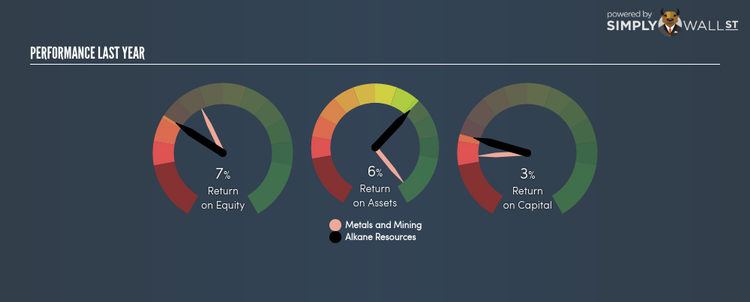
With An ROE Of 6.84%, Can Alkane Resources Limited (ASX:ALK) Catch Up To The Industry?

Alkane Resources Limited (ASX:ALK) generated a below-average return on equity of 6.84% in the past 12 months, while its industry returned 11.89%. An investor may attribute an inferior ROE to a relatively inefficient performance, and whilst this can often be the case, knowing the nuts and bolts of the ROE calculation may change that perspective and give you a deeper insight into ALK’s past performance. Today I will look at how components such as financial leverage can influence ROE which may impact the sustainability of ALK’s returns. See our latest analysis for Alkane Resources
Breaking down Return on Equity
Return on Equity (ROE) is a measure of Alkane Resources’s profit relative to its shareholders’ equity. An ROE of 6.84% implies A$0.07 returned on every A$1 invested. In most cases, a higher ROE is preferred; however, there are many other factors we must consider prior to making any investment decisions.
Return on Equity = Net Profit ÷ Shareholders Equity
ROE is assessed against cost of equity, which is measured using the Capital Asset Pricing Model (CAPM) – but let’s not dive into the details of that today. For now, let’s just look at the cost of equity number for Alkane Resources, which is 9.59%. Since Alkane Resources’s return does not cover its cost, with a difference of -2.75%, this means its current use of equity is not efficient and not sustainable. Very simply, Alkane Resources pays more for its capital than what it generates in return. ROE can be broken down into three different ratios: net profit margin, asset turnover, and financial leverage. This is called the Dupont Formula:
Dupont Formula
ROE = profit margin × asset turnover × financial leverage
ROE = (annual net profit ÷ sales) × (sales ÷ assets) × (assets ÷ shareholders’ equity)
ROE = annual net profit ÷ shareholders’ equity
Basically, profit margin measures how much of revenue trickles down into earnings which illustrates how efficient the business is with its cost management. Asset turnover shows how much revenue Alkane Resources can generate with its current asset base. The most interesting ratio, and reflective of sustainability of its ROE, is financial leverage. Since ROE can be artificially increased through excessive borrowing, we should check Alkane Resources’s historic debt-to-equity ratio. Currently, Alkane Resources has no debt which means its returns are driven purely by equity capital. This could explain why Alkane Resources’s’ ROE is lower than its industry peers, most of which may have some degree of debt in its business.

Next Steps:
While ROE is a relatively simple calculation, it can be broken down into different ratios, each telling a different story about the strengths and weaknesses of a company. Alkane Resources’s ROE is underwhelming relative to the industry average, and its returns were also not strong enough to cover its own cost of equity. Although, its appropriate level of leverage means investors can be more confident in the sustainability of Alkane Resources’s return with a possible increase should the company decide to increase its debt levels. Although ROE can be a useful metric, it is only a small part of diligent research.
For Alkane Resources, I’ve put together three relevant factors you should look at:
Financial Health: Does it have a healthy balance sheet? Take a look at our free balance sheet analysis with six simple checks on key factors like leverage and risk.
Valuation: What is Alkane Resources worth today? Is the stock undervalued, even when its growth outlook is factored into its intrinsic value? The intrinsic value infographic in our free research report helps visualize whether Alkane Resources is currently mispriced by the market.
Other High-Growth Alternatives : Are there other high-growth stocks you could be holding instead of Alkane Resources? Explore our interactive list of stocks with large growth potential to get an idea of what else is out there you may be missing!
To help readers see pass the short term volatility of the financial market, we aim to bring you a long-term focused research analysis purely driven by fundamental data. Note that our analysis does not factor in the latest price sensitive company announcements.
The author is an independent contributor and at the time of publication had no position in the stocks mentioned.
