Is Symrise (ETR:SY1) Using Too Much Debt?

Legendary fund manager Li Lu (who Charlie Munger backed) once said, 'The biggest investment risk is not the volatility of prices, but whether you will suffer a permanent loss of capital. When we think about how risky a company is, we always like to look at its use of debt, since debt overload can lead to ruin. Importantly, Symrise AG (ETR:SY1) does carry debt. But is this debt a concern to shareholders?
When Is Debt A Problem?
Debt assists a business until the business has trouble paying it off, either with new capital or with free cash flow. In the worst case scenario, a company can go bankrupt if it cannot pay its creditors. However, a more common (but still painful) scenario is that it has to raise new equity capital at a low price, thus permanently diluting shareholders. Of course, the upside of debt is that it often represents cheap capital, especially when it replaces dilution in a company with the ability to reinvest at high rates of return. The first step when considering a company's debt levels is to consider its cash and debt together.
See our latest analysis for Symrise
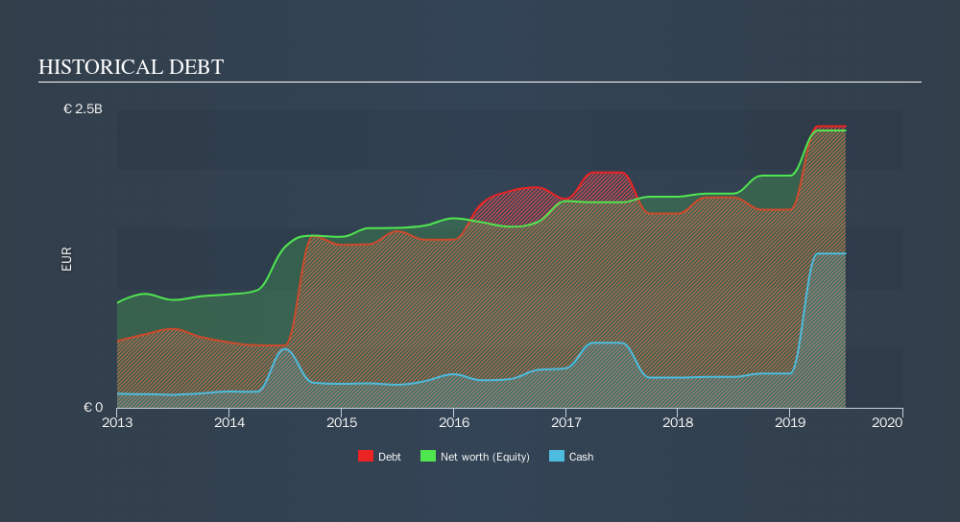
What Is Symrise's Debt?
The image below, which you can click on for greater detail, shows that at June 2019 Symrise had debt of €2.36b, up from €1.77b in one year. On the flip side, it has €1.29b in cash leading to net debt of about €1.07b.
How Healthy Is Symrise's Balance Sheet?
The latest balance sheet data shows that Symrise had liabilities of €1.16b due within a year, and liabilities of €2.66b falling due after that. Offsetting this, it had €1.29b in cash and €687.1m in receivables that were due within 12 months. So it has liabilities totalling €1.84b more than its cash and near-term receivables, combined.
Of course, Symrise has a titanic market capitalization of €11.7b, so these liabilities are probably manageable. But there are sufficient liabilities that we would certainly recommend shareholders continue to monitor the balance sheet, going forward.
We use two main ratios to inform us about debt levels relative to earnings. The first is net debt divided by earnings before interest, tax, depreciation, and amortization (EBITDA), while the second is how many times its earnings before interest and tax (EBIT) covers its interest expense (or its interest cover, for short). Thus we consider debt relative to earnings both with and without depreciation and amortization expenses.
Symrise's net debt to EBITDA ratio of about 1.6 suggests only moderate use of debt. And its strong interest cover of 12.5 times, makes us even more comfortable. Fortunately, Symrise grew its EBIT by 6.8% in the last year, making that debt load look even more manageable. When analysing debt levels, the balance sheet is the obvious place to start. But it is future earnings, more than anything, that will determine Symrise's ability to maintain a healthy balance sheet going forward. So if you're focused on the future you can check out this free report showing analyst profit forecasts.
Finally, while the tax-man may adore accounting profits, lenders only accept cold hard cash. So we clearly need to look at whether that EBIT is leading to corresponding free cash flow. In the last three years, Symrise's free cash flow amounted to 48% of its EBIT, less than we'd expect. That's not great, when it comes to paying down debt.
Our View
Symrise's interest cover suggests it can handle its debt as easily as Cristiano Ronaldo could score a goal against an under 14's goalkeeper. And we also thought its EBIT growth rate was a positive. Looking at all the aforementioned factors together, it strikes us that Symrise can handle its debt fairly comfortably. On the plus side, this leverage can boost shareholder returns, but the potential downside is more risk of loss, so it's worth monitoring the balance sheet. Over time, share prices tend to follow earnings per share, so if you're interested in Symrise, you may well want to click here to check an interactive graph of its earnings per share history.
If, after all that, you're more interested in a fast growing company with a rock-solid balance sheet, then check out our list of net cash growth stocks without delay.
We aim to bring you long-term focused research analysis driven by fundamental data. Note that our analysis may not factor in the latest price-sensitive company announcements or qualitative material.
If you spot an error that warrants correction, please contact the editor at editorial-team@simplywallst.com. This article by Simply Wall St is general in nature. It does not constitute a recommendation to buy or sell any stock, and does not take account of your objectives, or your financial situation. Simply Wall St has no position in the stocks mentioned. Thank you for reading.
