Will Taro Pharmaceutical Industries Ltd (NYSE:TARO) Continue To Underperform Its Industry?

Taro Pharmaceutical Industries Ltd (NYSE:TARO) delivered a less impressive 9.39% ROE over the past year, compared to the 12.26% return generated by its industry. An investor may attribute an inferior ROE to a relatively inefficient performance, and whilst this can often be the case, knowing the nuts and bolts of the ROE calculation may change that perspective and give you a deeper insight into TARO’s past performance. I will take you through how metrics such as financial leverage impact ROE which may affect the overall sustainability of TARO’s returns. Check out our latest analysis for Taro Pharmaceutical Industries
What you must know about ROE
Return on Equity (ROE) weighs Taro Pharmaceutical Industries’s profit against the level of its shareholders’ equity. It essentially shows how much the company can generate in earnings given the amount of equity it has raised. While a higher ROE is preferred in most cases, there are several other factors we should consider before drawing any conclusions.
Return on Equity = Net Profit ÷ Shareholders Equity
ROE is measured against cost of equity in order to determine the efficiency of Taro Pharmaceutical Industries’s equity capital deployed. Its cost of equity is 8.49%. While Taro Pharmaceutical Industries’s peers may have higher ROE, it may also incur higher cost of equity. An undesirable and unsustainable practice would be if returns exceeded cost. However, this is not the case for Taro Pharmaceutical Industries which is encouraging. ROE can be dissected into three distinct ratios: net profit margin, asset turnover, and financial leverage. This is called the Dupont Formula:
Dupont Formula
ROE = profit margin × asset turnover × financial leverage
ROE = (annual net profit ÷ sales) × (sales ÷ assets) × (assets ÷ shareholders’ equity)
ROE = annual net profit ÷ shareholders’ equity
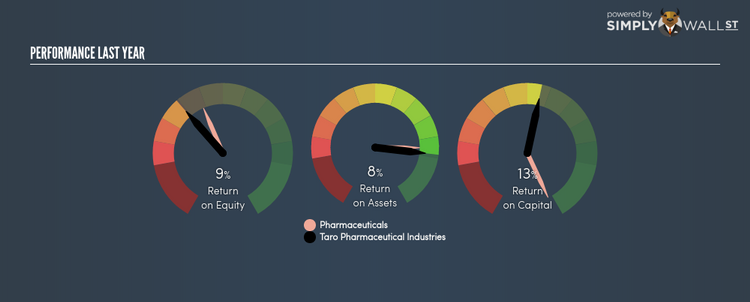
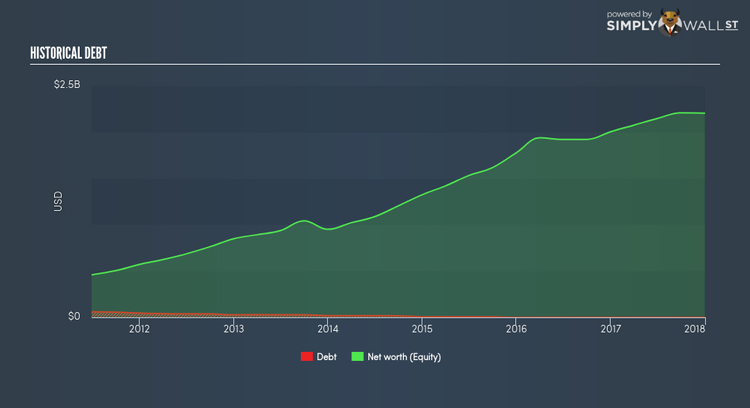
The first component is profit margin, which measures how much of sales is retained after the company pays for all its expenses. The other component, asset turnover, illustrates how much revenue Taro Pharmaceutical Industries can make from its asset base. Finally, financial leverage will be our main focus today. It shows how much of assets are funded by equity and can show how sustainable the company’s capital structure is. Since financial leverage can artificially inflate ROE, we need to look at how much debt Taro Pharmaceutical Industries currently has. Currently, Taro Pharmaceutical Industries has no debt which means its returns are driven purely by equity capital. This could explain why Taro Pharmaceutical Industries’s’ ROE is lower than its industry peers, most of which may have some degree of debt in its business.
Next Steps:
ROE is one of many ratios which meaningfully dissects financial statements, which illustrates the quality of a company. Although Taro Pharmaceutical Industries’s ROE is underwhelming relative to the industry average, its returns are high enough to cover the cost of equity. Also, ROE is not likely to be inflated by excessive debt funding, giving shareholders more conviction in the sustainability of returns, which has headroom to increase further. Although ROE can be a useful metric, it is only a small part of diligent research.
For Taro Pharmaceutical Industries, I’ve compiled three fundamental aspects you should look at:
Financial Health: Does it have a healthy balance sheet? Take a look at our free balance sheet analysis with six simple checks on key factors like leverage and risk.
Valuation: What is Taro Pharmaceutical Industries worth today? Is the stock undervalued, even when its growth outlook is factored into its intrinsic value? The intrinsic value infographic in our free research report helps visualize whether Taro Pharmaceutical Industries is currently mispriced by the market.
Other High-Growth Alternatives : Are there other high-growth stocks you could be holding instead of Taro Pharmaceutical Industries? Explore our interactive list of stocks with large growth potential to get an idea of what else is out there you may be missing!
To help readers see pass the short term volatility of the financial market, we aim to bring you a long-term focused research analysis purely driven by fundamental data. Note that our analysis does not factor in the latest price sensitive company announcements.
The author is an independent contributor and at the time of publication had no position in the stocks mentioned.
