What Is Taylor Devices's (NASDAQ:TAYD) P/E Ratio After Its Share Price Rocketed?

Those holding Taylor Devices (NASDAQ:TAYD) shares must be pleased that the share price has rebounded 43% in the last thirty days. But unfortunately, the stock is still down by 19% over a quarter. But shareholders may not all be feeling jubilant, since the share price is still down 16% in the last year.
All else being equal, a sharp share price increase should make a stock less attractive to potential investors. In the long term, share prices tend to follow earnings per share, but in the short term prices bounce around in response to short term factors (which are not always obvious). So some would prefer to hold off buying when there is a lot of optimism towards a stock. One way to gauge market expectations of a stock is to look at its Price to Earnings Ratio (PE Ratio). A high P/E implies that investors have high expectations of what a company can achieve compared to a company with a low P/E ratio.
View our latest analysis for Taylor Devices
Does Taylor Devices Have A Relatively High Or Low P/E For Its Industry?
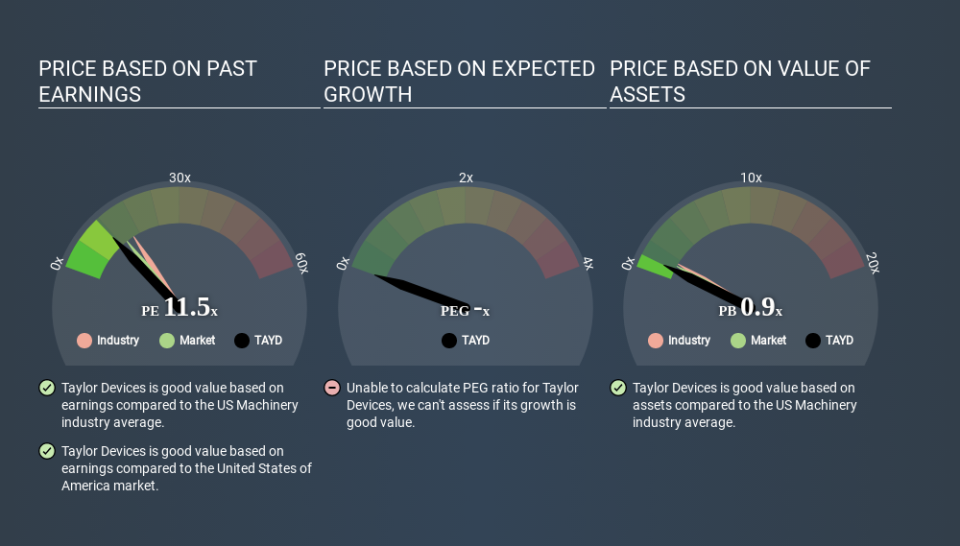
Taylor Devices's P/E of 11.46 indicates relatively low sentiment towards the stock. We can see in the image below that the average P/E (16.0) for companies in the machinery industry is higher than Taylor Devices's P/E.
Its relatively low P/E ratio indicates that Taylor Devices shareholders think it will struggle to do as well as other companies in its industry classification. Many investors like to buy stocks when the market is pessimistic about their prospects. You should delve deeper. I like to check if company insiders have been buying or selling.
How Growth Rates Impact P/E Ratios
P/E ratios primarily reflect market expectations around earnings growth rates. If earnings are growing quickly, then the 'E' in the equation will increase faster than it would otherwise. And in that case, the P/E ratio itself will drop rather quickly. So while a stock may look expensive based on past earnings, it could be cheap based on future earnings.
In the last year, Taylor Devices grew EPS like Taylor Swift grew her fan base back in 2010; the 80% gain was both fast and well deserved. Having said that, the average EPS growth over the last three years wasn't so good, coming in at 5.1%.
Remember: P/E Ratios Don't Consider The Balance Sheet
It's important to note that the P/E ratio considers the market capitalization, not the enterprise value. That means it doesn't take debt or cash into account. Theoretically, a business can improve its earnings (and produce a lower P/E in the future) by investing in growth. That means taking on debt (or spending its cash).
Such spending might be good or bad, overall, but the key point here is that you need to look at debt to understand the P/E ratio in context.
How Does Taylor Devices's Debt Impact Its P/E Ratio?
With net cash of US$15m, Taylor Devices has a very strong balance sheet, which may be important for its business. Having said that, at 44% of its market capitalization the cash hoard would contribute towards a higher P/E ratio.
The Verdict On Taylor Devices's P/E Ratio
Taylor Devices has a P/E of 11.5. That's below the average in the US market, which is 13.6. Not only should the net cash position reduce risk, but the recent growth has been impressive. One might conclude that the market is a bit pessimistic, given the low P/E ratio. What we know for sure is that investors have become more excited about Taylor Devices recently, since they have pushed its P/E ratio from 8.0 to 11.5 over the last month. If you like to buy stocks that have recently impressed the market, then this one might be a candidate; but if you prefer to invest when there is 'blood in the streets', then you may feel the opportunity has passed.
When the market is wrong about a stock, it gives savvy investors an opportunity. If it is underestimating a company, investors can make money by buying and holding the shares until the market corrects itself. Although we don't have analyst forecasts shareholders might want to examine this detailed historical graph of earnings, revenue and cash flow.
Of course, you might find a fantastic investment by looking at a few good candidates. So take a peek at this free list of companies with modest (or no) debt, trading on a P/E below 20.
If you spot an error that warrants correction, please contact the editor at editorial-team@simplywallst.com. This article by Simply Wall St is general in nature. It does not constitute a recommendation to buy or sell any stock, and does not take account of your objectives, or your financial situation. Simply Wall St has no position in the stocks mentioned.
We aim to bring you long-term focused research analysis driven by fundamental data. Note that our analysis may not factor in the latest price-sensitive company announcements or qualitative material. Thank you for reading.
