Should You Be Tempted To Sell Far East Orchard Limited (SGX:O10) Because Of Its P/E Ratio?

Want to participate in a short research study? Help shape the future of investing tools and receive a $20 prize!
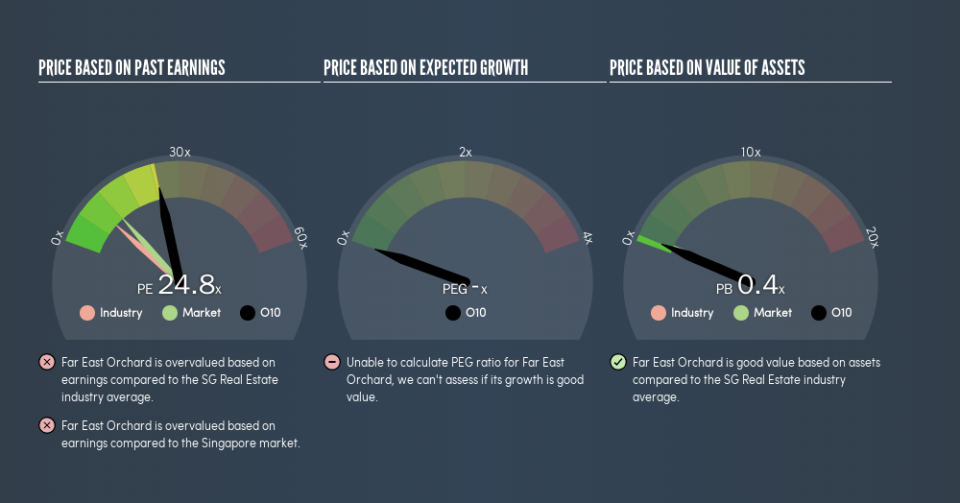
The goal of this article is to teach you how to use price to earnings ratios (P/E ratios). To keep it practical, we’ll show how Far East Orchard Limited’s (SGX:O10) P/E ratio could help you assess the value on offer. Based on the last twelve months, Far East Orchard’s P/E ratio is 24.83. That is equivalent to an earnings yield of about 4.0%.
See our latest analysis for Far East Orchard
How Do You Calculate A P/E Ratio?
The formula for P/E is:
Price to Earnings Ratio = Price per Share ÷ Earnings per Share (EPS)
Or for Far East Orchard:
P/E of 24.83 = SGD1.26 ÷ SGD0.051 (Based on the trailing twelve months to September 2018.)
Is A High P/E Ratio Good?
A higher P/E ratio means that buyers have to pay a higher price for each SGD1 the company has earned over the last year. That is not a good or a bad thing per se, but a high P/E does imply buyers are optimistic about the future.
How Growth Rates Impact P/E Ratios
Companies that shrink earnings per share quickly will rapidly decrease the ‘E’ in the equation. That means unless the share price falls, the P/E will increase in a few years. A higher P/E should indicate the stock is expensive relative to others — and that may encourage shareholders to sell.
It’s nice to see that Far East Orchard grew EPS by a stonking 108% in the last year. But earnings per share are down 3.6% per year over the last five years.
How Does Far East Orchard’s P/E Ratio Compare To Its Peers?
The P/E ratio essentially measures market expectations of a company. The image below shows that Far East Orchard has a higher P/E than the average (9.4) P/E for companies in the real estate industry.
That means that the market expects Far East Orchard will outperform other companies in its industry. Clearly the market expects growth, but it isn’t guaranteed. So further research is always essential. I often monitor director buying and selling.
Don’t Forget: The P/E Does Not Account For Debt or Bank Deposits
The ‘Price’ in P/E reflects the market capitalization of the company. In other words, it does not consider any debt or cash that the company may have on the balance sheet. Theoretically, a business can improve its earnings (and produce a lower P/E in the future), by taking on debt (or spending its remaining cash).
Such expenditure might be good or bad, in the long term, but the point here is that the balance sheet is not reflected by this ratio.
Is Debt Impacting Far East Orchard’s P/E?
Net debt totals just 7.1% of Far East Orchard’s market cap. So it doesn’t have as many options as it would with net cash, but its debt would not have much of an impact on its P/E ratio.
The Bottom Line On Far East Orchard’s P/E Ratio
Far East Orchard’s P/E is 24.8 which is above average (12.1) in the SG market. The company is not overly constrained by its modest debt levels, and it is growing earnings per share. So it does not seem strange that the P/E is above average.
When the market is wrong about a stock, it gives savvy investors an opportunity. People often underestimate remarkable growth — so investors can make money when fast growth is not fully appreciated. We don’t have analyst forecasts, but you could get a better understanding of its growth by checking out this more detailed historical graph of earnings, revenue and cash flow.
Of course, you might find a fantastic investment by looking at a few good candidates. So take a peek at this free list of companies with modest (or no) debt, trading on a P/E below 20.
We aim to bring you long-term focused research analysis driven by fundamental data. Note that our analysis may not factor in the latest price-sensitive company announcements or qualitative material.
If you spot an error that warrants correction, please contact the editor at editorial-team@simplywallst.com. This article by Simply Wall St is general in nature. It does not constitute a recommendation to buy or sell any stock, and does not take account of your objectives, or your financial situation. Simply Wall St has no position in the stocks mentioned. Thank you for reading.
