We Think Joint (NASDAQ:JYNT) Can Manage Its Debt With Ease

Some say volatility, rather than debt, is the best way to think about risk as an investor, but Warren Buffett famously said that 'Volatility is far from synonymous with risk. It's only natural to consider a company's balance sheet when you examine how risky it is, since debt is often involved when a business collapses. Importantly, The Joint Corp. (NASDAQ:JYNT) does carry debt. But should shareholders be worried about its use of debt?
Why Does Debt Bring Risk?
Debt assists a business until the business has trouble paying it off, either with new capital or with free cash flow. If things get really bad, the lenders can take control of the business. However, a more frequent (but still costly) occurrence is where a company must issue shares at bargain-basement prices, permanently diluting shareholders, just to shore up its balance sheet. Of course, plenty of companies use debt to fund growth, without any negative consequences. The first thing to do when considering how much debt a business uses is to look at its cash and debt together.
See our latest analysis for Joint
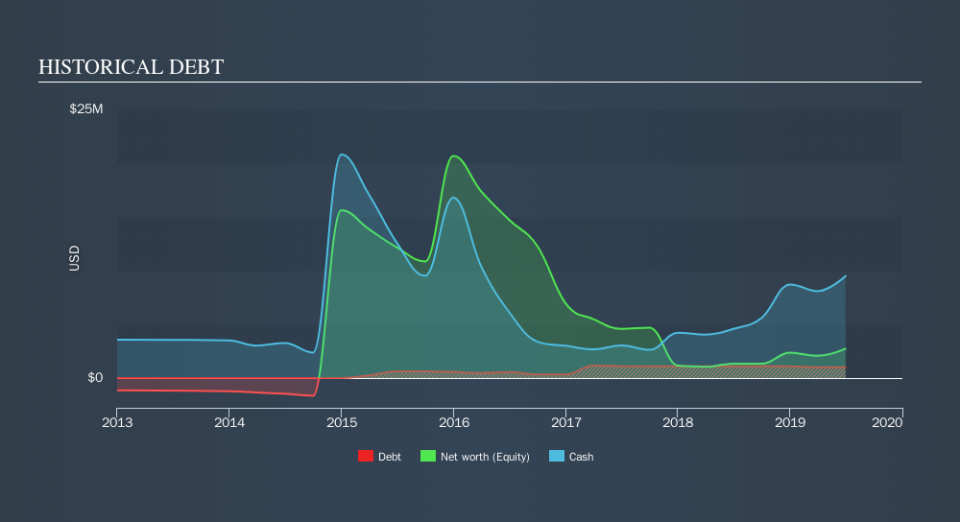
What Is Joint's Net Debt?
You can click the graphic below for the historical numbers, but it shows that Joint had US$1.00m of debt in June 2019, down from US$1.10m, one year before. But it also has US$9.49m in cash to offset that, meaning it has US$8.49m net cash.
How Healthy Is Joint's Balance Sheet?
Zooming in on the latest balance sheet data, we can see that Joint had liabilities of US$11.9m due within 12 months and liabilities of US$21.9m due beyond that. Offsetting these obligations, it had cash of US$9.49m as well as receivables valued at US$1.20m due within 12 months. So its liabilities total US$23.1m more than the combination of its cash and short-term receivables.
Of course, Joint has a market capitalization of US$246.7m, so these liabilities are probably manageable. Having said that, it's clear that we should continue to monitor its balance sheet, lest it change for the worse. While it does have liabilities worth noting, Joint also has more cash than debt, so we're pretty confident it can manage its debt safely.
It was also good to see that despite losing money on the EBIT line last year, Joint turned things around in the last 12 months, delivering and EBIT of US$2.2m. The balance sheet is clearly the area to focus on when you are analysing debt. But ultimately the future profitability of the business will decide if Joint can strengthen its balance sheet over time. So if you want to see what the professionals think, you might find this free report on analyst profit forecasts to be interesting.
Finally, while the tax-man may adore accounting profits, lenders only accept cold hard cash. While Joint has net cash on its balance sheet, it's still worth taking a look at its ability to convert earnings before interest and tax (EBIT) to free cash flow, to help us understand how quickly it is building (or eroding) that cash balance. Happily for any shareholders, Joint actually produced more free cash flow than EBIT over the last year. There's nothing better than incoming cash when it comes to staying in your lenders' good graces.
Summing up
We could understand if investors are concerned about Joint's liabilities, but we can be reassured by the fact it has has net cash of US$8.49m. The cherry on top was that in converted 199% of that EBIT to free cash flow, bringing in US$4.4m. So we don't think Joint's use of debt is risky. Another factor that would give us confidence in Joint would be if insiders have been buying shares: if you're conscious of that signal too, you can find out instantly by clicking this link.
If you're interested in investing in businesses that can grow profits without the burden of debt, then check out this free list of growing businesses that have net cash on the balance sheet.
We aim to bring you long-term focused research analysis driven by fundamental data. Note that our analysis may not factor in the latest price-sensitive company announcements or qualitative material.
If you spot an error that warrants correction, please contact the editor at editorial-team@simplywallst.com. This article by Simply Wall St is general in nature. It does not constitute a recommendation to buy or sell any stock, and does not take account of your objectives, or your financial situation. Simply Wall St has no position in the stocks mentioned. Thank you for reading.
