Those Who Purchased Sichuan Expressway (HKG:107) Shares Three Years Ago Have A 33% Loss To Show For It

Many investors define successful investing as beating the market average over the long term. But in any portfolio, there are likely to be some stocks that fall short of that benchmark. Unfortunately, that's been the case for longer term Sichuan Expressway Company Limited (HKG:107) shareholders, since the share price is down 33% in the last three years, falling well short of the market return of around 13%.
Check out our latest analysis for Sichuan Expressway
To quote Buffett, 'Ships will sail around the world but the Flat Earth Society will flourish. There will continue to be wide discrepancies between price and value in the marketplace...' One flawed but reasonable way to assess how sentiment around a company has changed is to compare the earnings per share (EPS) with the share price.
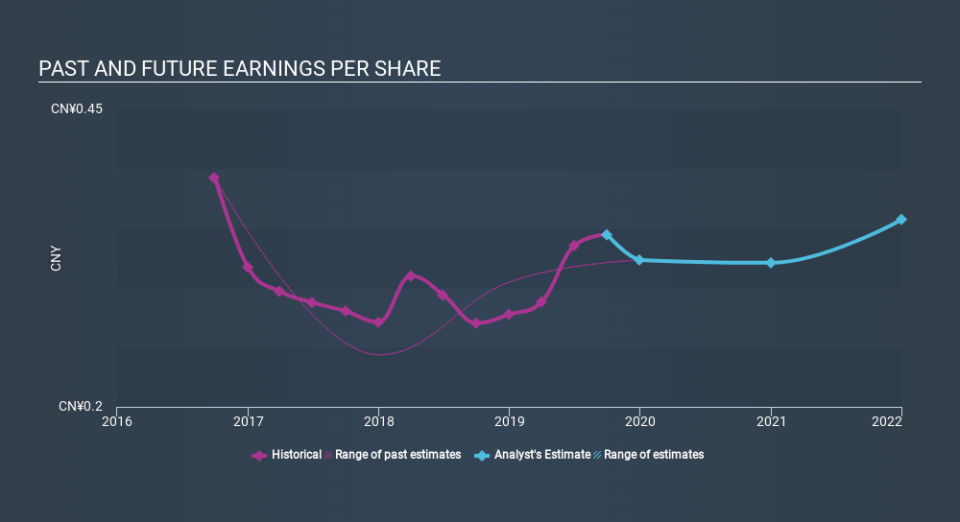
During the three years that the share price fell, Sichuan Expressway's earnings per share (EPS) dropped by 4.2% each year. The share price decline of 12% is actually steeper than the EPS slippage. So it seems the market was too confident about the business, in the past. This increased caution is also evident in the rather low P/E ratio, which is sitting at 5.80.
You can see how EPS has changed over time in the image below (click on the chart to see the exact values).
We're pleased to report that the CEO is remunerated more modestly than most CEOs at similarly capitalized companies. It's always worth keeping an eye on CEO pay, but a more important question is whether the company will grow earnings throughout the years. This free interactive report on Sichuan Expressway's earnings, revenue and cash flow is a great place to start, if you want to investigate the stock further.
What About Dividends?
When looking at investment returns, it is important to consider the difference between total shareholder return (TSR) and share price return. Whereas the share price return only reflects the change in the share price, the TSR includes the value of dividends (assuming they were reinvested) and the benefit of any discounted capital raising or spin-off. Arguably, the TSR gives a more comprehensive picture of the return generated by a stock. In the case of Sichuan Expressway, it has a TSR of -24% for the last 3 years. That exceeds its share price return that we previously mentioned. The dividends paid by the company have thusly boosted the total shareholder return.
A Different Perspective
We regret to report that Sichuan Expressway shareholders are down 9.8% for the year (even including dividends) . Unfortunately, that's worse than the broader market decline of 1.6%. Having said that, it's inevitable that some stocks will be oversold in a falling market. The key is to keep your eyes on the fundamental developments. Regrettably, last year's performance caps off a bad run, with the shareholders facing a total loss of 3.0% per year over five years. Generally speaking long term share price weakness can be a bad sign, though contrarian investors might want to research the stock in hope of a turnaround. It's always interesting to track share price performance over the longer term. But to understand Sichuan Expressway better, we need to consider many other factors. Case in point: We've spotted 3 warning signs for Sichuan Expressway you should be aware of, and 2 of them can't be ignored.
We will like Sichuan Expressway better if we see some big insider buys. While we wait, check out this free list of growing companies with considerable, recent, insider buying.
Please note, the market returns quoted in this article reflect the market weighted average returns of stocks that currently trade on HK exchanges.
If you spot an error that warrants correction, please contact the editor at editorial-team@simplywallst.com. This article by Simply Wall St is general in nature. It does not constitute a recommendation to buy or sell any stock, and does not take account of your objectives, or your financial situation. Simply Wall St has no position in the stocks mentioned.
We aim to bring you long-term focused research analysis driven by fundamental data. Note that our analysis may not factor in the latest price-sensitive company announcements or qualitative material. Thank you for reading.
