Top Ranked Value Stocks to Buy for June 3rd
Here are four stocks with buy rank and strong value characteristics for investors to consider today, June 3rd:
Ryerson Holding Corporation (RYI): This processor and distributor of industrial metals has a Zacks Rank #2 (Buy), and seen the Zacks Consensus Estimate for its current year earnings rising 53.4% over the last 60 days.
Ryerson Holding Corporation Price and Consensus
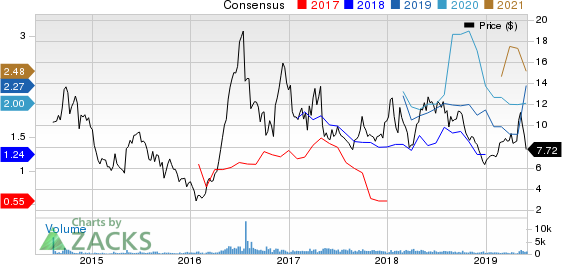
Ryerson Holding Corporation price-consensus-chart | Ryerson Holding Corporation Quote
Ryerson Holding has a price-to-earnings ratio (P/E) of 3.41, compared with 10.60 for the industry. The company possesses a Value Score of A.
Ryerson Holding Corporation PE Ratio (TTM)
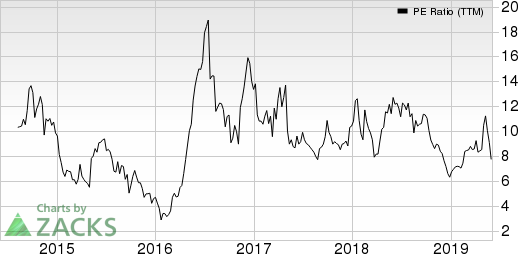
Ryerson Holding Corporation pe-ratio-ttm | Ryerson Holding Corporation Quote
Reliance Steel & Aluminum Co. (RS): This metals service center company has a Zacks Rank #2 (Buy), and seen the Zacks Consensus Estimate for its current year earnings rising 6.3% over the last 60 days.
Reliance Steel & Aluminum Co. Price and Consensus
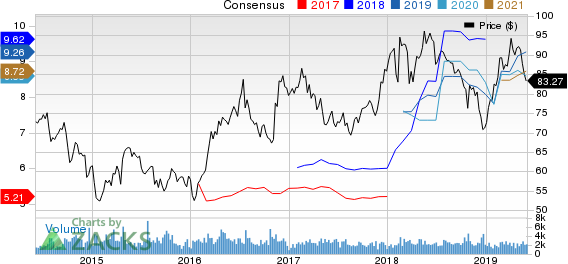
Reliance Steel & Aluminum Co. price-consensus-chart | Reliance Steel & Aluminum Co. Quote
Reliance Steel has a price-to-earnings ratio (P/E) of 8.99, compared with 17.10 for the industry. The company possesses a Value Score of A.
Reliance Steel & Aluminum Co. PE Ratio (TTM)

Reliance Steel & Aluminum Co. pe-ratio-ttm | Reliance Steel & Aluminum Co. Quote
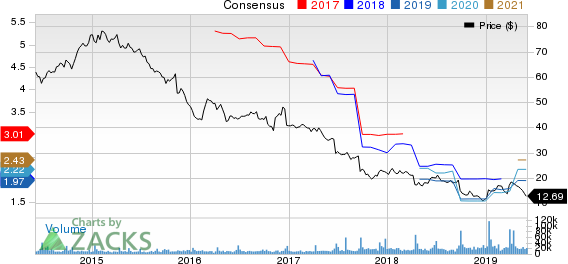
Wyndham Destinations, Inc. (WYND): This vacation ownership and exchange company has a Zacks Rank #2 (Buy), and seen the Zacks Consensus Estimate for its current year earnings rising 1.3% over the last 60 days.
WYNDHAM DESTINATIONS, INC. Price and Consensus

WYNDHAM DESTINATIONS, INC. price-consensus-chart | WYNDHAM DESTINATIONS, INC. Quote
Wyndham has a price-to-earnings ratio (P/E) of 7.38 compared with 67.90 for the industry. The company possesses a Value Score of A.
WYNDHAM DESTINATIONS, INC. PE Ratio (TTM)

WYNDHAM DESTINATIONS, INC. pe-ratio-ttm | WYNDHAM DESTINATIONS, INC. Quote
Bed Bath & Beyond Inc. (BBBY): This chain of retail stores has a Zacks Rank #2 (Buy), and seen the Zacks Consensus Estimate for its current year earnings rising 9.4% over the last 60 days.
Bed Bath & Beyond Inc. Price and Consensus
Bed Bath & Beyond Inc. price-consensus-chart | Bed Bath & Beyond Inc. Quote
Bed Bath & Beyond has a price-to-earnings ratio (P/E) of 6.43 compared with 12.90 for the industry. The company possesses a Value Score of A.
Bed Bath & Beyond Inc. PE Ratio (TTM)
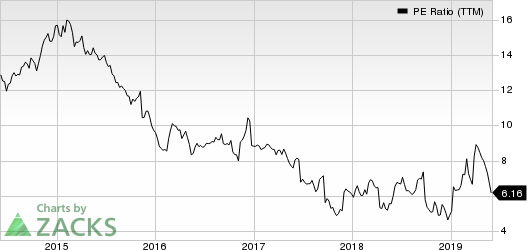
Bed Bath & Beyond Inc. pe-ratio-ttm | Bed Bath & Beyond Inc. Quote
See the full list of top ranked stocks here
Learn more about the Value score and how it is calculated here.
Will you retire a millionaire?
One out of every six people retires a multimillionaire. Get smart tips you can do today to become one of them in a new Special Report, “7 Things You Can Do Now to Retire a Multimillionaire.”
Click to get it free >>
Want the latest recommendations from Zacks Investment Research? Today, you can download 7 Best Stocks for the Next 30 Days. Click to get this free report
WYNDHAM DESTINATIONS, INC. (WYND) : Free Stock Analysis Report
Ryerson Holding Corporation (RYI) : Free Stock Analysis Report
Reliance Steel & Aluminum Co. (RS) : Free Stock Analysis Report
Bed Bath & Beyond Inc. (BBBY) : Free Stock Analysis Report
To read this article on Zacks.com click here.
Zacks Investment Research
