Should Union Pacific Corporation (NYSE:UNP) Be Part Of Your Dividend Portfolio?

Dividend paying stocks like Union Pacific Corporation (NYSE:UNP) tend to be popular with investors, and for good reason - some research suggests a significant amount of all stock market returns come from reinvested dividends. If you are hoping to live on your dividends, it's important to be more stringent with your investments than the average punter. Regular readers know we like to apply the same approach to each dividend stock, and we hope you'll find our analysis useful.
A slim 2.4% yield is hard to get excited about, but the long payment history is respectable. At the right price, or with strong growth opportunities, Union Pacific could have potential. The company also returned around 4.9% of its market capitalisation to shareholders in the form of stock buybacks over the past year. When buying stocks for their dividends, you should always run through the checks below, to see if the dividend looks sustainable.
Click the interactive chart for our full dividend analysis
Payout ratios
Dividends are typically paid from company earnings. If a company pays more in dividends than it earned, then the dividend might become unsustainable - hardly an ideal situation. As a result, we should always investigate whether a company can afford its dividend, measured as a percentage of a company's net income after tax. In the last year, Union Pacific paid out 44% of its profit as dividends. A medium payout ratio strikes a good balance between paying dividends, and keeping enough back to invest in the business. One of the risks is that management reinvests the retained capital poorly instead of paying a higher dividend.
We also measure dividends paid against a company's levered free cash flow, to see if enough cash was generated to cover the dividend. Of the free cash flow it generated last year, Union Pacific paid out 50% as dividends, suggesting the dividend is affordable. It's positive to see that Union Pacific's dividend is covered by both profits and cash flow, since this is generally a sign that the dividend is sustainable, and a lower payout ratio usually suggests a greater margin of safety before the dividend gets cut.
Is Union Pacific's Balance Sheet Risky?
As Union Pacific has a meaningful amount of debt, we need to check its balance sheet to see if the company might have debt risks. A rough way to check this is with these two simple ratios: a) net debt divided by EBITDA (earnings before interest, tax, depreciation and amortisation), and b) net interest cover. Net debt to EBITDA is a measure of a company's total debt. Net interest cover measures the ability to meet interest payments. Essentially we check that a) the company does not have too much debt, and b) that it can afford to pay the interest. With net debt of 2.37 times its EBITDA, Union Pacific's debt burden is within a normal range for most listed companies.
Net interest cover can be calculated by dividing earnings before interest and tax (EBIT) by the company's net interest expense. Union Pacific has EBIT of 8.62 times its interest expense, which we think is adequate.
Remember, you can always get a snapshot of Union Pacific's latest financial position, by checking our visualisation of its financial health.
Dividend Volatility
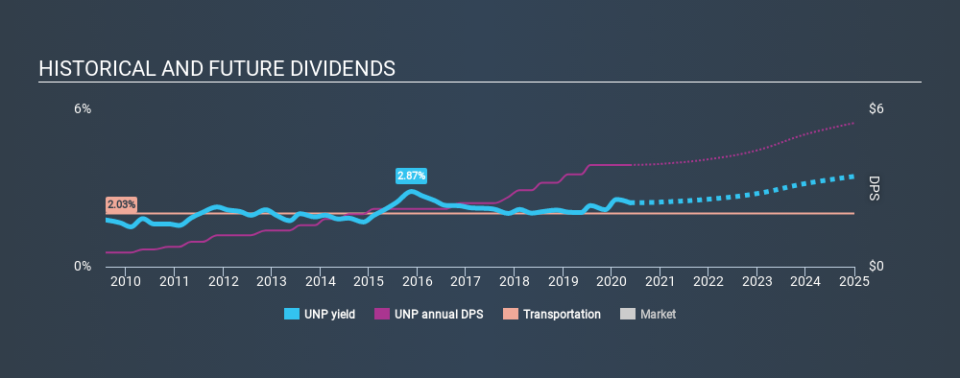
Before buying a stock for its income, we want to see if the dividends have been stable in the past, and if the company has a track record of maintaining its dividend. Union Pacific has been paying dividends for a long time, but for the purpose of this analysis, we only examine the past 10 years of payments. During this period the dividend has been stable, which could imply the business could have relatively consistent earnings power. During the past ten-year period, the first annual payment was US$0.54 in 2010, compared to US$3.88 last year. Dividends per share have grown at approximately 22% per year over this time.
Dividends have been growing pretty quickly, and even more impressively, they haven't experienced any notable falls during this period.
Dividend Growth Potential
Dividend payments have been consistent over the past few years, but we should always check if earnings per share (EPS) are growing, as this will help maintain the purchasing power of the dividend. Union Pacific has grown its earnings per share at 8.4% per annum over the past five years. It's good to see decent earnings growth and a low payout ratio. Companies with these characteristics often display the fastest dividend growth over the long term - assuming earnings can be maintained, of course.
Conclusion
To summarise, shareholders should always check that Union Pacific's dividends are affordable, that its dividend payments are relatively stable, and that it has decent prospects for growing its earnings and dividend. It's great to see that Union Pacific is paying out a low percentage of its earnings and cash flow. We like that it has been delivering solid improvement in its earnings per share, and relatively consistent dividend payments. Union Pacific has met all of our criteria, including having strong cash flow that covers the dividend. We definitely think it would be worthwhile looking closer.
It's important to note that companies having a consistent dividend policy will generate greater investor confidence than those having an erratic one. Still, investors need to consider a host of other factors, apart from dividend payments, when analysing a company. For instance, we've picked out 2 warning signs for Union Pacific that investors should take into consideration.
If you are a dividend investor, you might also want to look at our curated list of dividend stocks yielding above 3%.
Love or hate this article? Concerned about the content? Get in touch with us directly. Alternatively, email editorial-team@simplywallst.com.
This article by Simply Wall St is general in nature. It does not constitute a recommendation to buy or sell any stock, and does not take account of your objectives, or your financial situation. We aim to bring you long-term focused analysis driven by fundamental data. Note that our analysis may not factor in the latest price-sensitive company announcements or qualitative material. Simply Wall St has no position in any stocks mentioned. Thank you for reading.
