US Dollar Crumbles Anew, SPX 500 Jumps to 4-Week High
Talking Points
US Dollar Upswing Unravels, 2-Month Down Trend Resumes
S&P 500 Hits 4-Week High as 1700 Figure Returns to Focus
Gold Prices Recoil from $1400/oz, Challenge Trend Support
To receive Ilya's analysis directly via email, please SIGN UP HERE
Can’t access to the Dow Jones FXCM US Dollar Index? Try the USD basket on Mirror Trader. **
US DOLLAR TECHNICAL ANALYSIS – A break below a counter trend line support underpinning the upswing over the past month suggests the downtrend initiated at the July swing high as resumed. Sellers now aim to challenge the 38.2% Fibonacci expansion at 10673, with a break below that targeting the 50% level at 10631. Near-term resistance is at 10726, the 23.6% Fib.
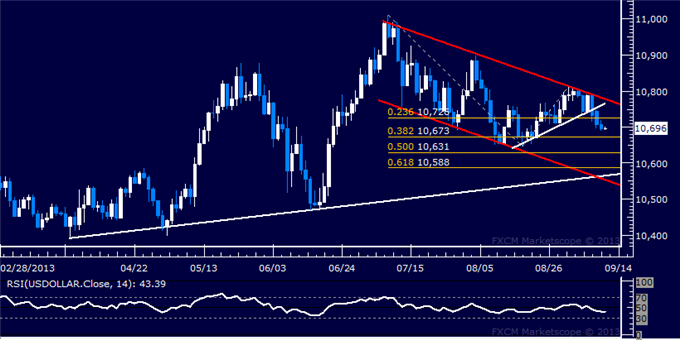
Daily Chart - Created Using FXCM Marketscope 2.0
** The Dow Jones FXCM US Dollar Index and the Mirror Trader USD basket are not the same product.
S&P 500 TECHNICAL ANALYSIS – Prices vaulted higher from support in a region bracketed by a pair of trend lines set from the November 2012, taking out the 23.6% Fibonacci expansion at 1662.10 to challenge the 38.2% level at 1684.10. A break above this barrier aims for the 1700.00 figure and the 50% Fib 1701.80. The 1662.10 level has been recast as support.

Daily Chart - Created Using FXCM Marketscope 2.0
GOLD TECHNICAL ANALYSIS – Prices pulled back to support marked by the bottom of a rising channel set from the late-June swing bottom and a horizontal pivot barrier at 1347.52. A break below that broadly aims for the 1300/oz figure. Near-term resistance is at 1415.33, the 38.2% Fibonacci retracement.

Daily Chart - Created Using FXCM Marketscope 2.0
CRUDE OIL TECHNICAL ANALYSIS– Prices declined as expected after putting in a bearish Dark Cloud Cover candlestick pattern at resistance in the 109.66-110.32 area, marked by the February 2012 closing high and the 50% Fibonacci expansion. Near-term support is at 106.04, the 23.6% Fib, followed by a rising trend line at 104.20.Initial resistance is at 108.40, the 38.2% level.
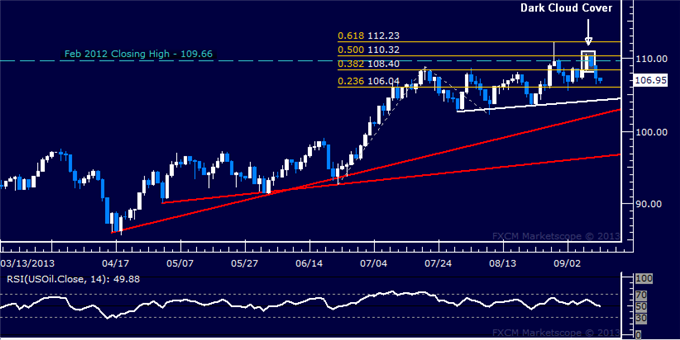
Daily Chart - Created Using FXCM Marketscope 2.0
--- Written by Ilya Spivak, Currency Strategist for Dailyfx.com
To contact Ilya, e-mail ispivak@dailyfx.com. Follow Ilya on Twitter at @IlyaSpivak
New to FX? Watch this Video. For live market updates, visit the Real Time News Feed
DailyFX provides forex news and technical analysis on the trends that influence the global currency markets.
Learn forex trading with a free practice account and trading charts from FXCM.
