US Dollar Flat, Gold Hinting at Rebound on US Budget Woes
Talking Points
US Dollar Range-Bound in Familiar Territory Above June Low
S&P 500 Recovers as Expected, Reclaims Foothold Above 1700
Gold Technical Positioning Hints at a Possible Rebound Ahead
To receive Ilya's analysis directly via email, please SIGN UP HERE
Can’t access to the Dow Jones FXCM US Dollar Index? Try the USD basket on Mirror Trader. **
US DOLLAR TECHNICAL ANALYSIS – Prices edged higher as expected after putting in a bullish Morning Star candlestick pattern above support at 10469, the June swing bottom. Initial resistance is at 10539, the 23.6% Fibonacci retracement, with a break above that targeting the 38.2% level at 10591.

Daily Chart - Created Using FXCM Marketscope 2.0
** The Dow Jones FXCM US Dollar Index and the Mirror Trader USD basket are not the same product.
S&P 500 TECHNICAL ANALYSIS – Prices recovered as expected after showing a Spinning Top candlestick at support marked by a rising trend line set from late February. Near-term resistance is now at 1713.30, the 61.8% Fibonacci expansion, with a break above that targeting the 76.4% level at 1729.00. Alternatively, a break below support at 1700.70 – the 50% Fib – exposes the 38.2% expansion at 1688.00
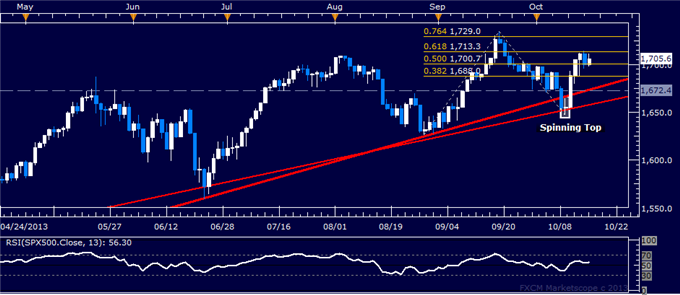
Daily Chart - Created Using FXCM Marketscope 2.0
GOLD TECHNICAL ANALYSIS – Prices put in a bullish Morning Star candlestick pattern, hinting a move higher is ahead. Initial resistance is at 1294.51, the 23.6% Fibonacci retracement. This barrier is reinforced by a falling trend line set from the August swing top. A break above that initially targets the 38.2% level at 1321.09. Near-term support is at 1251.54, the October 15 low.
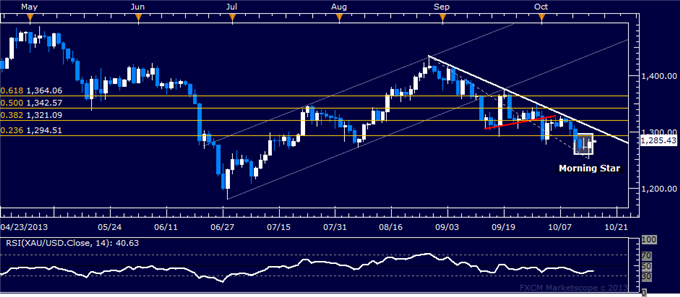
Daily Chart - Created Using FXCM Marketscope 2.0
CRUDE OIL TECHNICAL ANALYSIS– Prices are wedged between support at 100.88, a horizontal pivot dating back to April 2012, and the underside of a rising channel set from early July (105.17). A break upward aims for the underside of a rising trend line set from mid-April (108.33). Alternatively, a push through support initially targets supports at the 100.00 figure and 98.99.
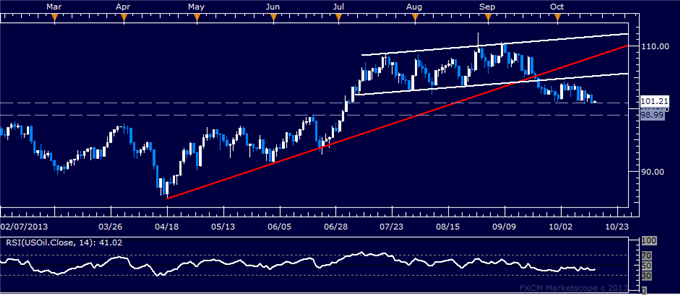
Daily Chart - Created Using FXCM Marketscope 2.0
--- Written by Ilya Spivak, Currency Strategist for DailyFX.com
Contact and follow Ilya on Twitter: @IlyaSpivak
For live market updates, visit the Real Time News Feed
DailyFX provides forex news and technical analysis on the trends that influence the global currency markets.
Learn forex trading with a free practice account and trading charts from FXCM.
