US Dollar Rebound Stalls, SPX 500 Aiming to Extend Recovery
Talking Points:
US Dollar Bounce Stalls After Three Consecutive Advances
S&P 500 Looks to Extend Recovery After Resistance Break
Crude Oil Struggles to Find Direction, Gold Aiming Lower
Can’t access to the Dow Jones FXCM US Dollar Index? Try the USD basket on Mirror Trader. **
US DOLLAR TECHNICAL ANALYSIS – Prices began to recover as expected afterputting in a bullish Piercing Line candlestick pattern. Initial resistance lines up in the 10473-84 area, marked by the underside of a previously broken falling channel and the 23.6% Fib retracement. A break above the latter barrier targets the 38.2% Fib at 10536. Near-term support is at 10400, the April 10 low.
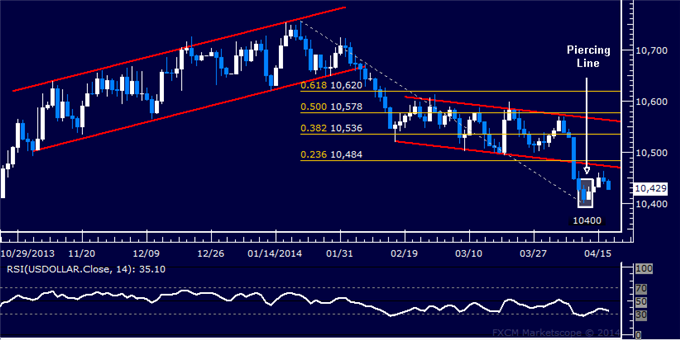
Daily Chart - Created Using FXCM Marketscope 2.0
** The Dow Jones FXCM US Dollar Index and the Mirror Trader USD basket are not the same product.
S&P 500 TECHNICAL ANALYSIS – Prices rebounded as expected after putting in a Piercing Line candlestick pattern. Prices have now cleared resistance at the top of a falling channel set from the April 4 high, exposing the 38.2% Fibonacci expansion at 1870.70. A further push beyond that aims for the 50% level at 1889.70. Near-term support is at 1847.10, the 23.6% Fib, followed by the channel top at 1840.70.
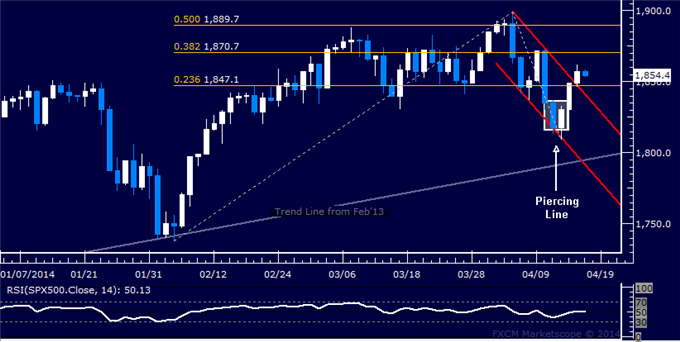
Daily Chart - Created Using FXCM Marketscope 2.0
GOLD TECHNICAL ANALYSIS – Prices reversed sharply downward, edging past support at 1303.93 marked by the 23.6% Fibonacci expansion and exposing the 38.2% level at 1287.14. A further push beneath that aims for the 50% Fib at 1273.57. Alternatively, a reversal back above 1303.93 sees the first layer of resistance at 1331.06, the April 15 high.
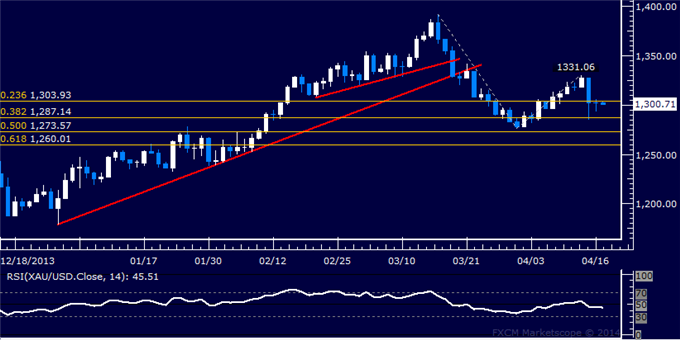
Daily Chart - Created Using FXCM Marketscope 2.0
CRUDE OIL TECHNICAL ANALYSIS – Prices broke higher as expected out of a Triangle chart formation. Buyers are testing resistance at 104.33 marked by the 50% Fibonacci expansion, with a break above that exposing the 61.8% level at 105.98. Near-term support is at 102.68, the 38.2% Fib, followed by the 23.6% expansion at 100.64.

Daily Chart - Created Using FXCM Marketscope 2.0
--- Written by Ilya Spivak, Currency Strategist for DailyFX.com
To receive Ilya's analysis directly via email, please SIGN UP HERE
Contact and follow Ilya on Twitter: @IlyaSpivak
DailyFX provides forex news and technical analysis on the trends that influence the global currency markets.
Learn forex trading with a free practice account and trading charts from FXCM.
