US Dollar Technical Analysis: Trend Line Resistance Caps Gains
US Dollar Technical Analysis– Prices are pulling back from falling trend line resistance set from the July 8 high (now at 10844) to test support in the 10790-803 area, marked by the 38.2% Fibonacci retracement and the June 24 high. A break downward initially eyes the 50% Fib at 10739. Alternatively, a reversal above the trend line sees the next level of resistance at 10882, the 23.6% level.
Confirm your chart-based trade setups with the Technical Analyzer.
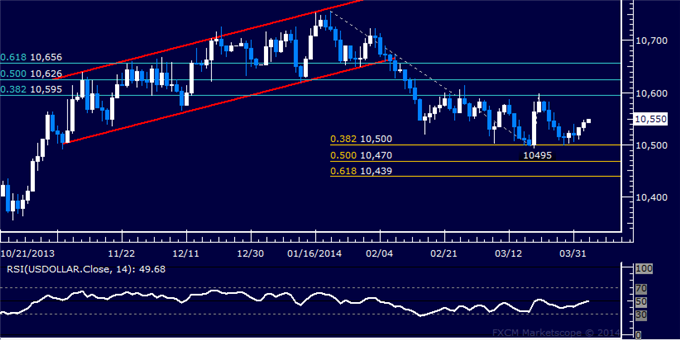
Daily Chart - Created Using FXCM Marketscope 2.0
--- Written by Ilya Spivak, Currency Strategist for Dailyfx.com
To contact Ilya, e-mail ispivak@dailyfx.com. Follow Ilya on Twitter at @IlyaSpivak
To be added to Ilya's e-mail distribution list, please CLICK HERE
New to FX? Watch this Video. For live market updates, visit the Real Time News Feed
DailyFX provides forex news and technical analysis on the trends that influence the global currency markets.
Learn forex trading with a free practice account and trading charts from FXCM.
