US Dollar Technical Outlook Favors Gains After Pullback
Talking Points
US Dollar Chart Setup Continues to Favor the Upside Scenario
S&P 500 Yet to Show Follow-Through on Bearish Candle Signal
Crude Oil Breaks Channel Support, Gold Targeting Sub-$1300
Can’t access to the Dow Jones FXCM US Dollar Index? Try the USD basket on Mirror Trader. **
US DOLLAR TECHNICAL ANALYSIS – Prices broke resistance at 10509, the 23.6% Fibonacci retracement level, exposing the 38.2% level at 10604. A further push above that targets the underside of a rising trend line set from early April, now at 10626. Alternatively, a move back below 10509 eyes falling trend line resistance-turned-support at 10483.
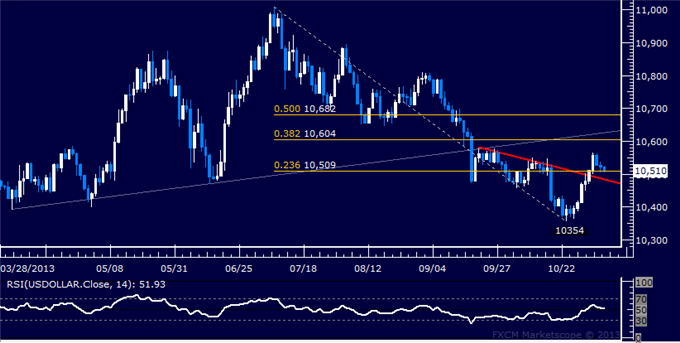
Daily Chart - Created Using FXCM Marketscope 2.0
** The Dow Jones FXCM US Dollar Index and the Mirror Trader USD basket are not the same product.
S&P 500 TECHNICAL ANALYSIS – Prices put in a Bearish Engulfing candlestick pattern, arguing for a reversal downward. Initial support is at 1747.70, the 23.6% Fibonacci retracement. A break below that initially exposes the 38.2% level at 1728.50. Near-term resistance is at 1778.90, the October 30 high.

Daily Chart - Created Using FXCM Marketscope 2.0
GOLD TECHNICAL ANALYSIS – Prices broke below support at 1318.73, the 23.6% Fibonacci expansion, exposing the 38.2% level at 1292.15. A further push beneath that eyes the 50% Fib at 1270.67. Alternatively, a move back above 1318.73 targets the 14.6% expansion at 1335.12.

Daily Chart - Created Using FXCM Marketscope 2.0
CRUDE OIL TECHNICAL ANALYSIS– Prices broke through the bottom of a falling channel set from late August, exposing the 100% Fibonacci expansion at 93.18. A further push below that eyes the 123.6% level at 90.54. Alternatively, a move back above the channel bottom sees the first layer of resistance at 95.82, the 76.4% Fib.

Daily Chart - Created Using FXCM Marketscope 2.0
--- Written by Ilya Spivak, Currency Strategist for DailyFX.com
To receive Ilya's analysis directly via email, please SIGN UP HERE
Contact and follow Ilya on Twitter: @IlyaSpivak
DailyFX provides forex news and technical analysis on the trends that influence the global currency markets.
Learn forex trading with a free practice account and trading charts from FXCM.
