Weak Financial Prospects Seem To Be Dragging Down Graham Corporation (NYSE:GHM) Stock
With its stock down 6.1% over the past three months, it is easy to disregard Graham (NYSE:GHM). To decide if this trend could continue, we decided to look at its weak fundamentals as they shape the long-term market trends. Particularly, we will be paying attention to Graham's ROE today.
Return on equity or ROE is an important factor to be considered by a shareholder because it tells them how effectively their capital is being reinvested. In simpler terms, it measures the profitability of a company in relation to shareholder's equity.
See our latest analysis for Graham
How Is ROE Calculated?
ROE can be calculated by using the formula:
Return on Equity = Net Profit (from continuing operations) ÷ Shareholders' Equity
So, based on the above formula, the ROE for Graham is:
1.0% = US$1.1m ÷ US$103m (Based on the trailing twelve months to June 2021).
The 'return' is the income the business earned over the last year. So, this means that for every $1 of its shareholder's investments, the company generates a profit of $0.01.
What Is The Relationship Between ROE And Earnings Growth?
So far, we've learned that ROE is a measure of a company's profitability. Based on how much of its profits the company chooses to reinvest or "retain", we are then able to evaluate a company's future ability to generate profits. Generally speaking, other things being equal, firms with a high return on equity and profit retention, have a higher growth rate than firms that don’t share these attributes.
Graham's Earnings Growth And 1.0% ROE
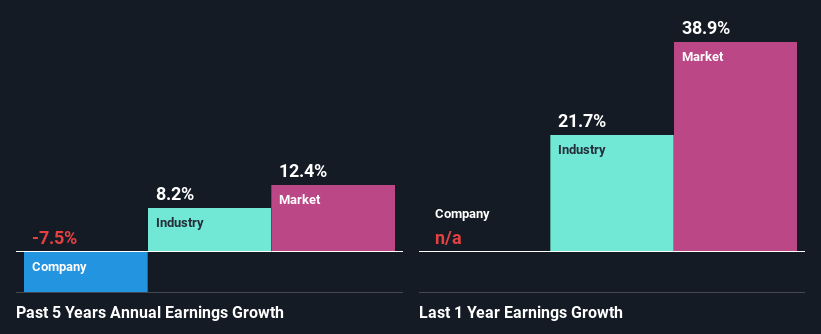
It is quite clear that Graham's ROE is rather low. Not just that, even compared to the industry average of 11%, the company's ROE is entirely unremarkable. For this reason, Graham's five year net income decline of 7.5% is not surprising given its lower ROE. We believe that there also might be other aspects that are negatively influencing the company's earnings prospects. For example, the business has allocated capital poorly, or that the company has a very high payout ratio.
That being said, we compared Graham's performance with the industry and were concerned when we found that while the company has shrunk its earnings, the industry has grown its earnings at a rate of 8.2% in the same period.
Earnings growth is an important metric to consider when valuing a stock. What investors need to determine next is if the expected earnings growth, or the lack of it, is already built into the share price. Doing so will help them establish if the stock's future looks promising or ominous. Is GHM fairly valued? This infographic on the company's intrinsic value has everything you need to know.
Is Graham Efficiently Re-investing Its Profits?
Graham's very high LTM (or last twelve month) payout ratio of 414% over the last three years suggests that the company is paying its shareholders more than what it is earning and this explains the company's shrinking earnings. Paying a dividend higher than reported profits is not a sustainable move. You can see the 2 risks we have identified for Graham by visiting our risks dashboard for free on our platform here.
Moreover, Graham has been paying dividends for at least ten years or more suggesting that management must have perceived that the shareholders prefer dividends over earnings growth.
Conclusion
On the whole, Graham's performance is quite a big let-down. The low ROE, combined with the fact that the company is paying out almost if not all, of its profits as dividends, has resulted in the lack or absence of growth in its earnings. With that said, we studied the latest analyst forecasts and found that while the company has shrunk its earnings in the past, analysts expect its earnings to grow in the future. Are these analysts expectations based on the broad expectations for the industry, or on the company's fundamentals? Click here to be taken to our analyst's forecasts page for the company.
This article by Simply Wall St is general in nature. We provide commentary based on historical data and analyst forecasts only using an unbiased methodology and our articles are not intended to be financial advice. It does not constitute a recommendation to buy or sell any stock, and does not take account of your objectives, or your financial situation. We aim to bring you long-term focused analysis driven by fundamental data. Note that our analysis may not factor in the latest price-sensitive company announcements or qualitative material. Simply Wall St has no position in any stocks mentioned.
Have feedback on this article? Concerned about the content? Get in touch with us directly. Alternatively, email editorial-team (at) simplywallst.com.
