Where Salvatore Ferragamo S.p.A.'s (BIT:SFER) Earnings Growth Stands Against Its Industry

When Salvatore Ferragamo S.p.A. (BIT:SFER) announced its most recent earnings (30 June 2019), I did two things: looked at its past earnings track record, then look at what is happening in the industry. Understanding how Salvatore Ferragamo performed requires a benchmark rather than trying to assess a standalone number at one point in time. Below is a quick commentary on how I see SFER has performed.
View our latest analysis for Salvatore Ferragamo
Did SFER perform worse than its track record and industry?
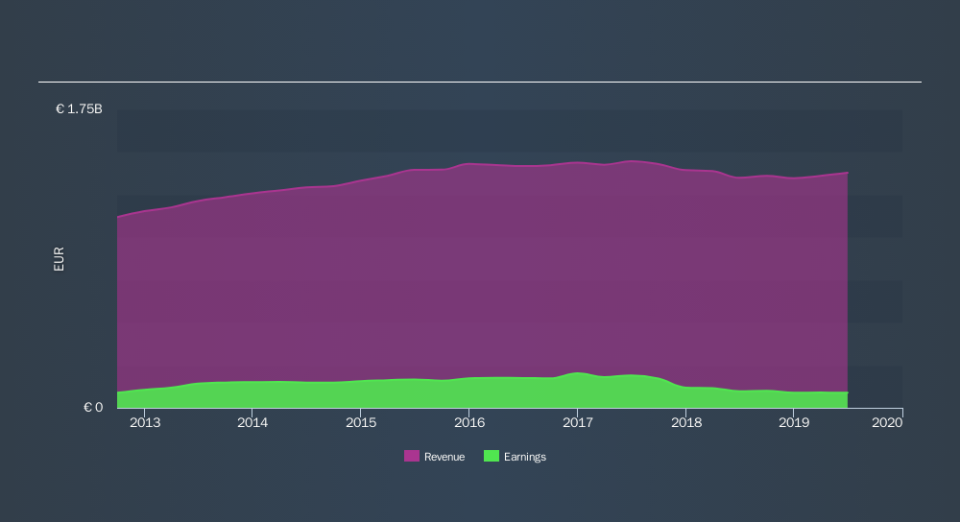
SFER's trailing twelve-month earnings (from 30 June 2019) of €89m has declined by -8.9% compared to the previous year.
Furthermore, this one-year growth rate has been lower than its average earnings growth rate over the past 5 years of -10%, indicating the rate at which SFER is growing has slowed down. What could be happening here? Well, let's look at what's going on with margins and if the entire industry is experiencing the hit as well.
In terms of returns from investment, Salvatore Ferragamo has fallen short of achieving a 20% return on equity (ROE), recording 12% instead. Furthermore, its return on assets (ROA) of 5.4% is below the IT Luxury industry of 6.2%, indicating Salvatore Ferragamo's are utilized less efficiently. And finally, its return on capital (ROC), which also accounts for Salvatore Ferragamo’s debt level, has declined over the past 3 years from 36% to 12%.
What does this mean?
Though Salvatore Ferragamo's past data is helpful, it is only one aspect of my investment thesis. Generally companies that face a prolonged period of diminishing earnings are undergoing some sort of reinvestment phase in order to keep up with the recent industry expansion and disruption. I suggest you continue to research Salvatore Ferragamo to get a more holistic view of the stock by looking at:
Future Outlook: What are well-informed industry analysts predicting for SFER’s future growth? Take a look at our free research report of analyst consensus for SFER’s outlook.
Financial Health: Are SFER’s operations financially sustainable? Balance sheets can be hard to analyze, which is why we’ve done it for you. Check out our financial health checks here.
Other High-Performing Stocks: Are there other stocks that provide better prospects with proven track records? Explore our free list of these great stocks here.
NB: Figures in this article are calculated using data from the trailing twelve months from 30 June 2019. This may not be consistent with full year annual report figures.
We aim to bring you long-term focused research analysis driven by fundamental data. Note that our analysis may not factor in the latest price-sensitive company announcements or qualitative material.
If you spot an error that warrants correction, please contact the editor at editorial-team@simplywallst.com. This article by Simply Wall St is general in nature. It does not constitute a recommendation to buy or sell any stock, and does not take account of your objectives, or your financial situation. Simply Wall St has no position in the stocks mentioned. Thank you for reading.
