Why Amcor plc’s (ASX:AMC) Return On Capital Employed Might Be A Concern

Today we are going to look at Amcor plc (ASX:AMC) to see whether it might be an attractive investment prospect. Specifically, we'll consider its Return On Capital Employed (ROCE), since that will give us an insight into how efficiently the business can generate profits from the capital it requires.
First of all, we'll work out how to calculate ROCE. Next, we'll compare it to others in its industry. Then we'll determine how its current liabilities are affecting its ROCE.
Understanding Return On Capital Employed (ROCE)
ROCE is a metric for evaluating how much pre-tax income (in percentage terms) a company earns on the capital invested in its business. All else being equal, a better business will have a higher ROCE. In brief, it is a useful tool, but it is not without drawbacks. Renowned investment researcher Michael Mauboussin has suggested that a high ROCE can indicate that 'one dollar invested in the company generates value of more than one dollar'.
How Do You Calculate Return On Capital Employed?
The formula for calculating the return on capital employed is:
Return on Capital Employed = Earnings Before Interest and Tax (EBIT) ÷ (Total Assets - Current Liabilities)
Or for Amcor:
0.071 = US$912m ÷ (US$17b - US$3.8b) (Based on the trailing twelve months to September 2019.)
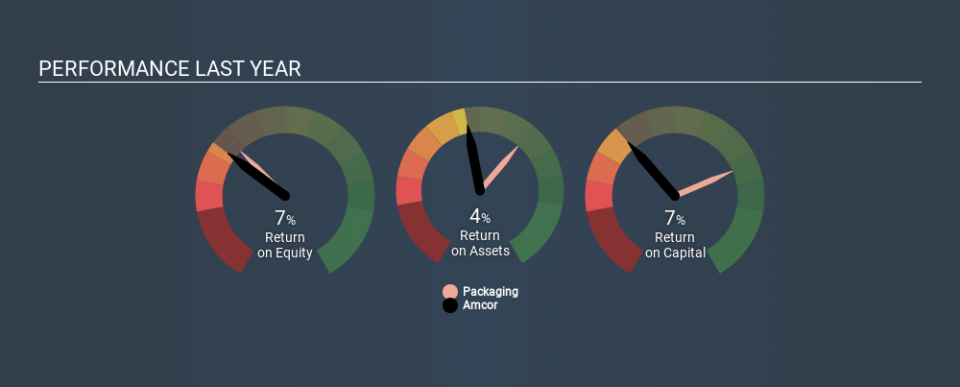
So, Amcor has an ROCE of 7.1%.
View our latest analysis for Amcor
Does Amcor Have A Good ROCE?
ROCE is commonly used for comparing the performance of similar businesses. In this analysis, Amcor's ROCE appears meaningfully below the 11% average reported by the Packaging industry. This could be seen as a negative, as it suggests some competitors may be employing their capital more efficiently. Setting aside the industry comparison for now, Amcor's ROCE is mediocre in absolute terms, considering the risk of investing in stocks versus the safety of a bank account. It is possible that there are more rewarding investments out there.
Amcor's current ROCE of 7.1% is lower than its ROCE in the past, which was 20%, 3 years ago. So investors might consider if it has had issues recently. You can see in the image below how Amcor's ROCE compares to its industry. Click to see more on past growth.
When considering ROCE, bear in mind that it reflects the past and does not necessarily predict the future. ROCE can be deceptive for cyclical businesses, as returns can look incredible in boom times, and terribly low in downturns. This is because ROCE only looks at one year, instead of considering returns across a whole cycle. Future performance is what matters, and you can see analyst predictions in our free report on analyst forecasts for the company.
Amcor's Current Liabilities And Their Impact On Its ROCE
Current liabilities are short term bills and invoices that need to be paid in 12 months or less. The ROCE equation subtracts current liabilities from capital employed, so a company with a lot of current liabilities appears to have less capital employed, and a higher ROCE than otherwise. To check the impact of this, we calculate if a company has high current liabilities relative to its total assets.
Amcor has total liabilities of US$3.8b and total assets of US$17b. As a result, its current liabilities are equal to approximately 23% of its total assets. It is good to see a restrained amount of current liabilities, as this limits the effect on ROCE.
Our Take On Amcor's ROCE
If Amcor continues to earn an uninspiring ROCE, there may be better places to invest. But note: make sure you look for a great company, not just the first idea you come across. So take a peek at this free list of interesting companies with strong recent earnings growth (and a P/E ratio below 20).
For those who like to find winning investments this free list of growing companies with recent insider purchasing, could be just the ticket.
If you spot an error that warrants correction, please contact the editor at editorial-team@simplywallst.com. This article by Simply Wall St is general in nature. It does not constitute a recommendation to buy or sell any stock, and does not take account of your objectives, or your financial situation. Simply Wall St has no position in the stocks mentioned.
We aim to bring you long-term focused research analysis driven by fundamental data. Note that our analysis may not factor in the latest price-sensitive company announcements or qualitative material. Thank you for reading.
