Why High Liner Foods Incorporated (TSX:HLF) Delivered An Inferior ROE Compared To The Industry

High Liner Foods Incorporated (TSX:HLF) generated a below-average return on equity of 10.73% in the past 12 months, while its industry returned 13.45%. Though HLF's recent performance is underwhelming, it is useful to understand what ROE is made up of and how it should be interpreted. Knowing these components can change your views on HLF's below-average returns. Metrics such as financial leverage can impact the level of ROE which in turn can affect the sustainability of HLF's returns. Let me show you what I mean by this. View our latest analysis for High Liner Foods
Breaking down ROE — the mother of all ratios
Return on Equity (ROE) weighs HLF’s profit against the level of its shareholders’ equity. It essentially shows how much HLF can generate in earnings given the amount of equity it has raised. In most cases, a higher ROE is preferred; however, there are many other factors we must consider prior to making any investment decisions.
Return on Equity = Net Profit ÷ Shareholders Equity
ROE is assessed against cost of equity, which is measured using the Capital Asset Pricing Model (CAPM) – but let’s not dive into the details of that today. For now, let’s just look at the cost of equity number for HLF, which is 8.49%. HLF’s ROE exceeds its cost by 2.24%, which is a big tick. Some of its peers with higher ROE may face a cost which exceeds returns, which is unsustainable and far less desirable than HLF’s case of positive discrepancy. ROE can be split up into three useful ratios: net profit margin, asset turnover, and financial leverage. This is called the Dupont Formula:
Dupont Formula
ROE = profit margin × asset turnover × financial leverage
ROE = (annual net profit ÷ sales) × (sales ÷ assets) × (assets ÷ shareholders’ equity)
ROE = annual net profit ÷ shareholders’ equity

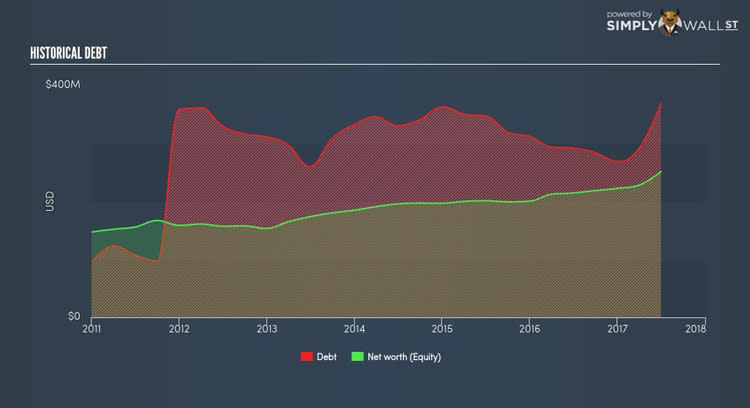
Essentially, profit margin shows how much money the company makes after paying for all its expenses. The other component, asset turnover, illustrates how much revenue HLF can make from its asset base. The most interesting ratio, and reflective of sustainability of its ROE, is financial leverage. Since financial leverage can artificially inflate ROE, we need to look at how much debt HLF currently has. At 146.51%, HLF’s debt-to-equity ratio appears balanced and indicates its ROE is generated from its capacity to increase profit without a large debt burden.
What this means for you:
Are you a shareholder? Although HLF’s ROE is underwhelming relative to the industry average, its returns are high enough to cover the cost of equity, which is encouraging. Since ROE is not inflated by excessive debt, it might be a good time to add more of HLF to your portfolio if your personal research is confirming what the ROE is telling you. If you're looking for new ideas for high-returning stocks, you should take a look at our free platform to see the list of stocks with Return on Equity over 20%.
Are you a potential investor? If you are considering investing in HLF, looking at ROE on its own is not enough to make a well-informed decision. I recommend you do additional fundamental analysis by looking through our most recent infographic report on High Liner Foods to help you make a more informed investment decision.
To help readers see pass the short term volatility of the financial market, we aim to bring you a long-term focused research analysis purely driven by fundamental data. Note that our analysis does not factor in the latest price sensitive company announcements.
The author is an independent contributor and at the time of publication had no position in the stocks mentioned.
