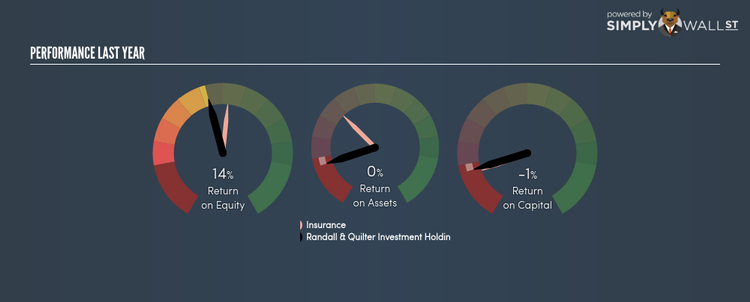
Why Randall & Quilter Investment Holdings Ltd’s (LON:RQIH) ROE Of 13.62% Does Not Tell The Whole Story

Randall & Quilter Investment Holdings Ltd (AIM:RQIH) generated a below-average return on equity of 13.62% in the past 12 months, while its industry returned 16.93%. An investor may attribute an inferior ROE to a relatively inefficient performance, and whilst this can often be the case, knowing the nuts and bolts of the ROE calculation may change that perspective and give you a deeper insight into RQIH’s past performance. I will take you through how metrics such as financial leverage impact ROE which may affect the overall sustainability of RQIH’s returns. See our latest analysis for Randall & Quilter Investment Holdings
Breaking down Return on Equity
Return on Equity (ROE) is a measure of Randall & Quilter Investment Holdings’s profit relative to its shareholders’ equity. For example, if the company invests £1 in the form of equity, it will generate £0.14 in earnings from this. Generally speaking, a higher ROE is preferred; however, there are other factors we must also consider before making any conclusions.
Return on Equity = Net Profit ÷ Shareholders Equity
Returns are usually compared to costs to measure the efficiency of capital. Randall & Quilter Investment Holdings’s cost of equity is 8.30%. While Randall & Quilter Investment Holdings’s peers may have higher ROE, it may also incur higher cost of equity. An undesirable and unsustainable practice would be if returns exceeded cost. However, this is not the case for Randall & Quilter Investment Holdings which is encouraging. ROE can be dissected into three distinct ratios: net profit margin, asset turnover, and financial leverage. This is called the Dupont Formula:
Dupont Formula
ROE = profit margin × asset turnover × financial leverage
ROE = (annual net profit ÷ sales) × (sales ÷ assets) × (assets ÷ shareholders’ equity)
ROE = annual net profit ÷ shareholders’ equity
Essentially, profit margin shows how much money the company makes after paying for all its expenses. Asset turnover reveals how much revenue can be generated from Randall & Quilter Investment Holdings’s asset base. And finally, financial leverage is simply how much of assets are funded by equity, which exhibits how sustainable the company’s capital structure is. Since ROE can be artificially increased through excessive borrowing, we should check Randall & Quilter Investment Holdings’s historic debt-to-equity ratio. The debt-to-equity ratio currently stands at a sensible 64.54%, meaning the ROE is a result of its capacity to produce profit growth without a huge debt burden.

Next Steps:
ROE is a simple yet informative ratio, illustrating the various components that each measure the quality of the overall stock. Even though Randall & Quilter Investment Holdings returned below the industry average, its ROE comes in excess of its cost of equity. Its appropriate level of leverage means investors can be more confident in the sustainability of Randall & Quilter Investment Holdings’s return with a possible increase should the company decide to increase its debt levels. Although ROE can be a useful metric, it is only a small part of diligent research.
For Randall & Quilter Investment Holdings, I’ve put together three fundamental factors you should look at:
1. Financial Health: Does it have a healthy balance sheet? Take a look at our free balance sheet analysis with six simple checks on key factors like leverage and risk.
2. Valuation: What is Randall & Quilter Investment Holdings worth today? Is the stock undervalued, even when its growth outlook is factored into its intrinsic value? The intrinsic value infographic in our free research report helps visualize whether Randall & Quilter Investment Holdings is currently mispriced by the market.
3. Other High-Growth Alternatives : Are there other high-growth stocks you could be holding instead of Randall & Quilter Investment Holdings? Explore our interactive list of stocks with large growth potential to get an idea of what else is out there you may be missing!
To help readers see pass the short term volatility of the financial market, we aim to bring you a long-term focused research analysis purely driven by fundamental data. Note that our analysis does not factor in the latest price sensitive company announcements.
The author is an independent contributor and at the time of publication had no position in the stocks mentioned.
