Why Trimble Inc (NASDAQ:TRMB) Delivered An Inferior ROE Compared To The Industry

This article is intended for those of you who are at the beginning of your investing journey and want to begin learning the link between Trimble Inc (NASDAQ:TRMB)’s return fundamentals and stock market performance.
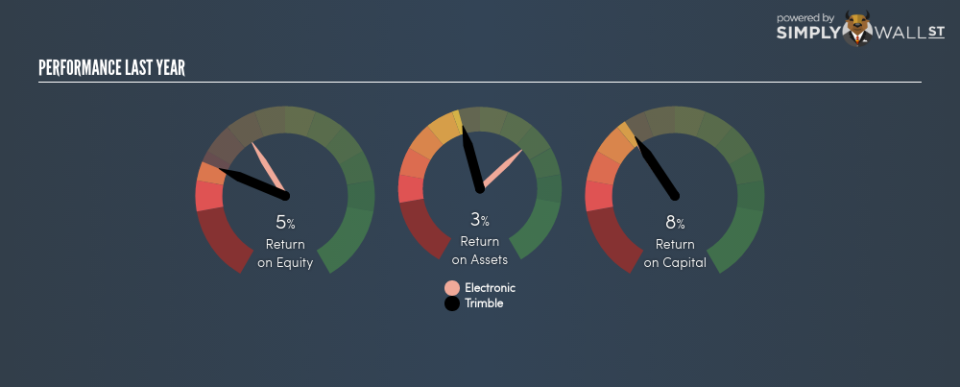
Trimble Inc (NASDAQ:TRMB) generated a below-average return on equity of 5.20% in the past 12 months, while its industry returned 10.91%. Though TRMB’s recent performance is underwhelming, it is useful to understand what ROE is made up of and how it should be interpreted. Knowing these components can change your views on TRMB’s below-average returns. Metrics such as financial leverage can impact the level of ROE which in turn can affect the sustainability of TRMB’s returns. Let me show you what I mean by this. See our latest analysis for Trimble
Breaking down ROE — the mother of all ratios
Return on Equity (ROE) weighs Trimble’s profit against the level of its shareholders’ equity. An ROE of 5.20% implies $0.052 returned on every $1 invested. While a higher ROE is preferred in most cases, there are several other factors we should consider before drawing any conclusions.
Return on Equity = Net Profit ÷ Shareholders Equity
Returns are usually compared to costs to measure the efficiency of capital. Trimble’s cost of equity is 9.69%. Given a discrepancy of -4.48% between return and cost, this indicated that Trimble may be paying more for its capital than what it’s generating in return. ROE can be dissected into three distinct ratios: net profit margin, asset turnover, and financial leverage. This is called the Dupont Formula:
Dupont Formula
ROE = profit margin × asset turnover × financial leverage
ROE = (annual net profit ÷ sales) × (sales ÷ assets) × (assets ÷ shareholders’ equity)
ROE = annual net profit ÷ shareholders’ equity
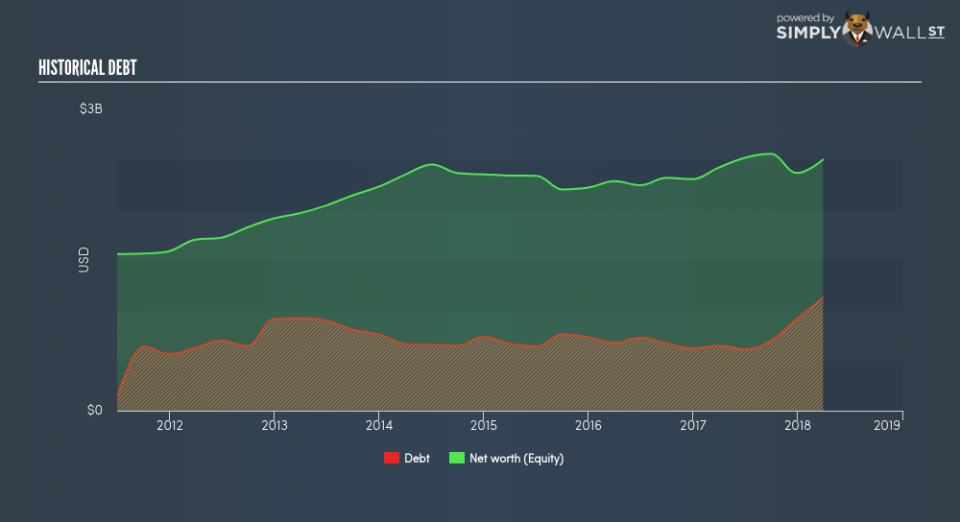
Essentially, profit margin shows how much money the company makes after paying for all its expenses. Asset turnover reveals how much revenue can be generated from Trimble’s asset base. Finally, financial leverage will be our main focus today. It shows how much of assets are funded by equity and can show how sustainable the company’s capital structure is. Since financial leverage can artificially inflate ROE, we need to look at how much debt Trimble currently has. The debt-to-equity ratio currently stands at a sensible 44.89%, meaning the ROE is a result of its capacity to produce profit growth without a huge debt burden.
Next Steps:
While ROE is a relatively simple calculation, it can be broken down into different ratios, each telling a different story about the strengths and weaknesses of a company. Trimble exhibits a weak ROE against its peers, as well as insufficient levels to cover its own cost of equity this year. Although, its appropriate level of leverage means investors can be more confident in the sustainability of Trimble’s return with a possible increase should the company decide to increase its debt levels. ROE is a helpful signal, but it is definitely not sufficient on its own to make an investment decision.
For Trimble, there are three relevant factors you should further research:
Financial Health: Does it have a healthy balance sheet? Take a look at our free balance sheet analysis with six simple checks on key factors like leverage and risk.
Valuation: What is Trimble worth today? Is the stock undervalued, even when its growth outlook is factored into its intrinsic value? The intrinsic value infographic in our free research report helps visualize whether Trimble is currently mispriced by the market.
Other High-Growth Alternatives : Are there other high-growth stocks you could be holding instead of Trimble? Explore our interactive list of stocks with large growth potential to get an idea of what else is out there you may be missing!
To help readers see pass the short term volatility of the financial market, we aim to bring you a long-term focused research analysis purely driven by fundamental data. Note that our analysis does not factor in the latest price sensitive company announcements.
The author is an independent contributor and at the time of publication had no position in the stocks mentioned.
