Should We Worry About Mid Penn Bancorp, Inc.'s (NASDAQ:MPB) P/E Ratio?

This article is for investors who would like to improve their understanding of price to earnings ratios (P/E ratios). To keep it practical, we'll show how Mid Penn Bancorp, Inc.'s (NASDAQ:MPB) P/E ratio could help you assess the value on offer. Based on the last twelve months, Mid Penn Bancorp's P/E ratio is 13.42. In other words, at today's prices, investors are paying $13.42 for every $1 in prior year profit.
See our latest analysis for Mid Penn Bancorp
How Do You Calculate A P/E Ratio?
The formula for price to earnings is:
Price to Earnings Ratio = Share Price ÷ Earnings per Share (EPS)
Or for Mid Penn Bancorp:
P/E of 13.42 = $28.34 ÷ $2.11 (Based on the trailing twelve months to September 2019.)
Is A High Price-to-Earnings Ratio Good?
A higher P/E ratio means that buyers have to pay a higher price for each $1 the company has earned over the last year. All else being equal, it's better to pay a low price -- but as Warren Buffett said, 'It's far better to buy a wonderful company at a fair price than a fair company at a wonderful price'.
How Does Mid Penn Bancorp's P/E Ratio Compare To Its Peers?
We can get an indication of market expectations by looking at the P/E ratio. The image below shows that Mid Penn Bancorp has a P/E ratio that is roughly in line with the banks industry average (12.8).
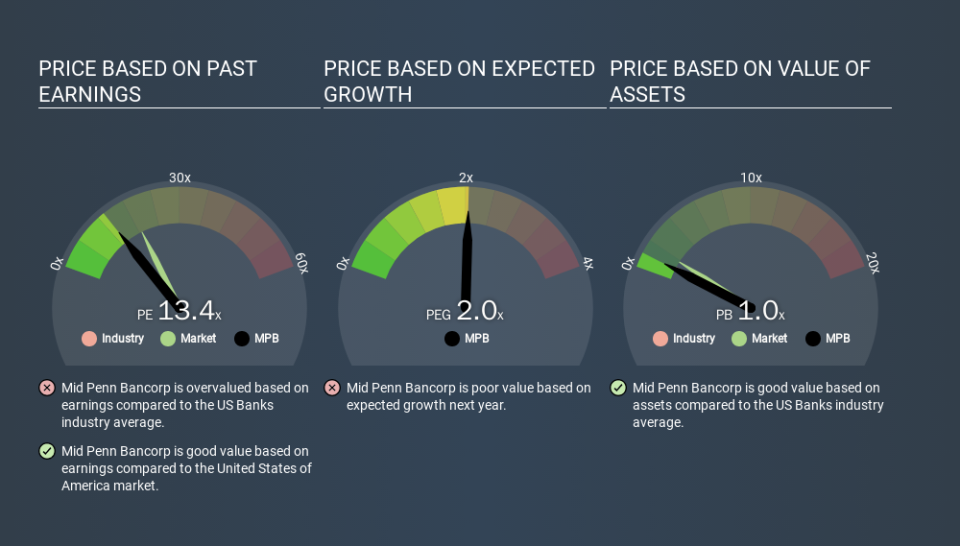
That indicates that the market expects Mid Penn Bancorp will perform roughly in line with other companies in its industry. If the company has better than average prospects, then the market might be underestimating it. Checking factors such as director buying and selling. could help you form your own view on if that will happen.
How Growth Rates Impact P/E Ratios
Probably the most important factor in determining what P/E a company trades on is the earnings growth. If earnings are growing quickly, then the 'E' in the equation will increase faster than it would otherwise. And in that case, the P/E ratio itself will drop rather quickly. And as that P/E ratio drops, the company will look cheap, unless its share price increases.
Mid Penn Bancorp's earnings made like a rocket, taking off 98% last year. Having said that, if we look back three years, EPS growth has averaged a comparatively less impressive 7.8%.
Don't Forget: The P/E Does Not Account For Debt or Bank Deposits
The 'Price' in P/E reflects the market capitalization of the company. Thus, the metric does not reflect cash or debt held by the company. Hypothetically, a company could reduce its future P/E ratio by spending its cash (or taking on debt) to achieve higher earnings.
Spending on growth might be good or bad a few years later, but the point is that the P/E ratio does not account for the option (or lack thereof).
Is Debt Impacting Mid Penn Bancorp's P/E?
With net cash of US$62m, Mid Penn Bancorp has a very strong balance sheet, which may be important for its business. Having said that, at 26% of its market capitalization the cash hoard would contribute towards a higher P/E ratio.
The Bottom Line On Mid Penn Bancorp's P/E Ratio
Mid Penn Bancorp trades on a P/E ratio of 13.4, which is below the US market average of 18.7. It grew its EPS nicely over the last year, and the healthy balance sheet implies there is more potential for growth. One might conclude that the market is a bit pessimistic, given the low P/E ratio.
Investors should be looking to buy stocks that the market is wrong about. As value investor Benjamin Graham famously said, 'In the short run, the market is a voting machine but in the long run, it is a weighing machine. So this free visualization of the analyst consensus on future earnings could help you make the right decision about whether to buy, sell, or hold.
But note: Mid Penn Bancorp may not be the best stock to buy. So take a peek at this free list of interesting companies with strong recent earnings growth (and a P/E ratio below 20).
If you spot an error that warrants correction, please contact the editor at editorial-team@simplywallst.com. This article by Simply Wall St is general in nature. It does not constitute a recommendation to buy or sell any stock, and does not take account of your objectives, or your financial situation. Simply Wall St has no position in the stocks mentioned.
We aim to bring you long-term focused research analysis driven by fundamental data. Note that our analysis may not factor in the latest price-sensitive company announcements or qualitative material. Thank you for reading.
