Should We Worry About Ollie’s Bargain Outlet Holdings Inc’s (NASDAQ:OLLI) P/E Ratio?

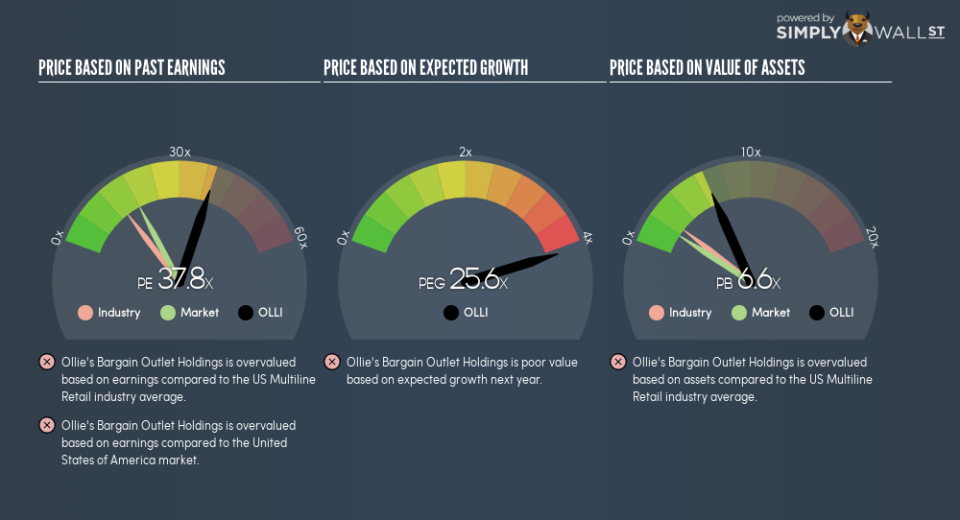
The goal of this article is to teach you how to use price to earnings ratios (P/E ratios). We’ll show how you can use Ollie’s Bargain Outlet Holdings Inc’s (NASDAQ:OLLI) P/E ratio to inform your assessment of the investment opportunity. Based on the last twelve months, Ollie’s Bargain Outlet Holdings’s P/E ratio is 37.82. That corresponds to an earnings yield of approximately 2.6%.
Check out our latest analysis for Ollie’s Bargain Outlet Holdings
How Do You Calculate A P/E Ratio?
The formula for price to earnings is:
Price to Earnings Ratio = Price per Share ÷ Earnings per Share (EPS)
Or for Ollie’s Bargain Outlet Holdings:
P/E of 37.82 = $91.04 ÷ $2.41 (Based on the year to August 2018.)
Is A High P/E Ratio Good?
A higher P/E ratio means that investors are paying a higher price for each $1 of company earnings. All else being equal, it’s better to pay a low price — but as Warren Buffett said, ‘It’s far better to buy a wonderful company at a fair price than a fair company at a wonderful price.’
How Growth Rates Impact P/E Ratios
Earnings growth rates have a big influence on P/E ratios. When earnings grow, the ‘E’ increases, over time. That means even if the current P/E is high, it will reduce over time if the share price stays flat. Then, a lower P/E should attract more buyers, pushing the share price up.
Notably, Ollie’s Bargain Outlet Holdings grew EPS by a whopping 97% in the last year. And it has bolstered its earnings per share by 41% per year over the last five years. So we’d generally expect it to have a relatively high P/E ratio.
How Does Ollie’s Bargain Outlet Holdings’s P/E Ratio Compare To Its Peers?
We can get an indication of market expectations by looking at the P/E ratio. You can see in the image below that the average P/E (13.9) for companies in the multiline retail industry is lower than Ollie’s Bargain Outlet Holdings’s P/E.
That means that the market expects Ollie’s Bargain Outlet Holdings will outperform other companies in its industry. Clearly the market expects growth, but it isn’t guaranteed. So further research is always essential. I often monitor director buying and selling.
Don’t Forget: The P/E Does Not Account For Debt or Bank Deposits
The ‘Price’ in P/E reflects the market capitalization of the company. That means it doesn’t take debt or cash into account. Hypothetically, a company could reduce its future P/E ratio by spending its cash (or taking on debt) to achieve higher earnings.
Such expenditure might be good or bad, in the long term, but the point here is that the balance sheet is not reflected by this ratio.
Is Debt Impacting Ollie’s Bargain Outlet Holdings’s P/E?
Ollie’s Bargain Outlet Holdings has net cash of US$7.7m. That should lead to a higher P/E than if it did have debt, because its strong balance sheets gives it more options.
The Bottom Line On Ollie’s Bargain Outlet Holdings’s P/E Ratio
Ollie’s Bargain Outlet Holdings has a P/E of 37.8. That’s higher than the average in the US market, which is 17.9. Its net cash position supports a higher P/E ratio, as does its solid recent earnings growth. So it does not seem strange that the P/E is above average.
Investors have an opportunity when market expectations about a stock are wrong. If the reality for a company is better than it expects, you can make money by buying and holding for the long term. So this free visual report on analyst forecasts could hold they key to an excellent investment decision.
Of course, you might find a fantastic investment by looking at a few good candidates. So take a peek at this free list of companies with modest (or no) debt, trading on a P/E below 20.
To help readers see past the short term volatility of the financial market, we aim to bring you a long-term focused research analysis purely driven by fundamental data. Note that our analysis does not factor in the latest price-sensitive company announcements.
The author is an independent contributor and at the time of publication had no position in the stocks mentioned. For errors that warrant correction please contact the editor at editorial-team@simplywallst.com.
