With 11.3% Earnings Growth Lately, Did Weyco Group Inc (WEYS) Outperform The Industry?

Today I will take a look at Weyco Group Inc’s (NASDAQ:WEYS) most recent earnings update (30 September 2017) and compare these latest figures against its performance over the past few years, as well as how the rest of the distributors industry performed. As an investor, I find it beneficial to assess WEYS’s trend over the short-to-medium term in order to gauge whether or not the company is able to meet its goals, and ultimately sustainably grow over time. See our latest analysis for WEYS
How Did WEYS’s Recent Performance Stack Up Against Its Past?
To account for any quarterly or half-yearly updates, I use data from the most recent 12 months, which annualizes the most recent half-year data, or in some cases, the latest annual report is already the most recent financial year data. This blend enables me to analyze different stocks on a more comparable basis, using the latest information. For Weyco Group, the most recent twelve-month earnings is $16.6M, which, relative to the previous year’s level, has risen by a relatively muted 8.45%. Given that these values may be relatively short-term thinking, I have determined an annualized five-year value for Weyco Group’s net income, which stands at $16.9M. This means despite the fact that earnings increased from last year’s level, over a longer period of time, Weyco Group’s earnings have been diminishing on average.
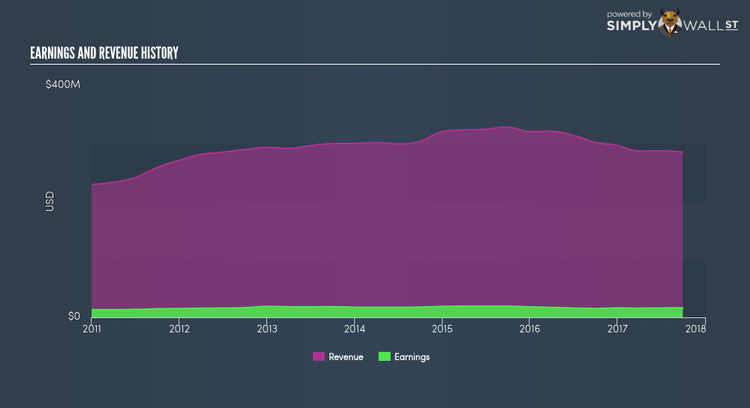
Why is this? Well, let’s look at what’s transpiring with margins and whether the whole industry is facing the same headwind. Revenue growth in the last couple of years, has been positive, however, earnings growth has failed to keep up meaning Weyco Group has been ramping up its expenses by a lot more. This harms margins and earnings, and is not a sustainable practice. Eyeballing growth from a sector-level, the US distributors industry has been growing, albeit, at a unexciting single-digit rate of 4.66% over the prior year, and 4.92% over the past five. This shows that any near-term headwind the industry is experiencing, Weyco Group is less exposed compared to its peers.
What does this mean?
Though Weyco Group’s past data is helpful, it is only one aspect of my investment thesis. Recent positive growth isn’t always indicative of a continued optimistic outlook.
I suggest you continue to research Weyco Group to get a more holistic view of the stock by looking at:
1. Financial Health: Is WEYS’s operations financially sustainable? Balance sheets can be hard to analyze, which is why we’ve done it for you. Check out our financial health checks here.
2. Valuation: What is WEYS worth today? Is the stock undervalued, even when its growth outlook is factored into its intrinsic value? The intrinsic value infographic in our free research report helps visualize whether WEYS is currently mispriced by the market.
3. Other High-Performing Stocks: Are there other stocks that provide better prospects with proven track records? Explore our free list of these great stocks here.
NB: Figures in this article are calculated using data from the last twelve months, which refer to the 12-month period ending on the last date of the month the financial statement is dated. This may not be consistent with full year annual report figures.
To help readers see pass the short term volatility of the financial market, we aim to bring you a long-term focused research analysis purely driven by fundamental data. Note that our analysis does not factor in the latest price sensitive company announcements.
The author is an independent contributor and at the time of publication had no position in the stocks mentioned.
