With A 2.8% Return On Equity, Is SS&C Technologies Holdings, Inc. (NASDAQ:SSNC) A Quality Stock?

Want to participate in a short research study? Help shape the future of investing tools and you could win a $250 gift card!
While some investors are already well versed in financial metrics (hat tip), this article is for those who would like to learn about Return On Equity (ROE) and why it is important. We'll use ROE to examine SS&C Technologies Holdings, Inc. (NASDAQ:SSNC), by way of a worked example.
Over the last twelve months SS&C Technologies Holdings has recorded a ROE of 2.8%. One way to conceptualize this, is that for each $1 of shareholders' equity it has, the company made $0.028 in profit.
View our latest analysis for SS&C Technologies Holdings
How Do I Calculate Return On Equity?
The formula for ROE is:
Return on Equity = Net Profit ÷ Shareholders' Equity
Or for SS&C Technologies Holdings:
2.8% = US$133m ÷ US$4.7b (Based on the trailing twelve months to March 2019.)
Most readers would understand what net profit is, but it’s worth explaining the concept of shareholders’ equity. It is the capital paid in by shareholders, plus any retained earnings. You can calculate shareholders' equity by subtracting the company's total liabilities from its total assets.
What Does Return On Equity Mean?
Return on Equity measures a company's profitability against the profit it has kept for the business (plus any capital injections). The 'return' is the amount earned after tax over the last twelve months. That means that the higher the ROE, the more profitable the company is. So, all else equal, investors should like a high ROE. That means ROE can be used to compare two businesses.
Does SS&C Technologies Holdings Have A Good ROE?
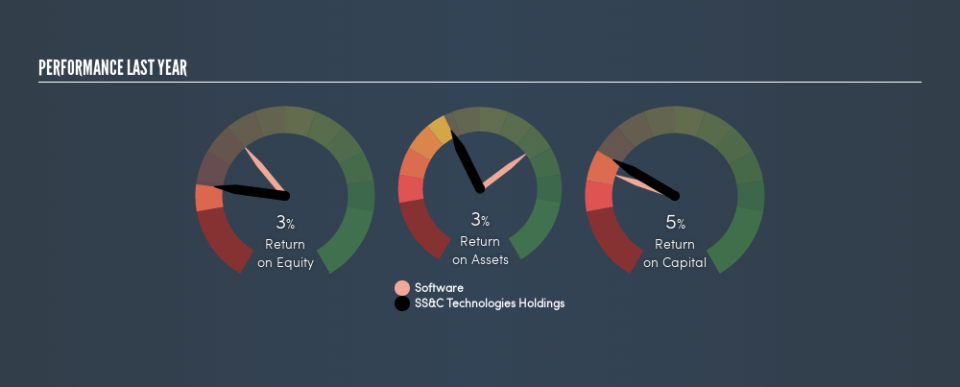
One simple way to determine if a company has a good return on equity is to compare it to the average for its industry. However, this method is only useful as a rough check, because companies do differ quite a bit within the same industry classification. If you look at the image below, you can see SS&C Technologies Holdings has a lower ROE than the average (9.7%) in the Software industry classification.
That's not what we like to see. It is better when the ROE is above industry average, but a low one doesn't necessarily mean the business is overpriced. Nonetheless, it could be useful to double-check if insiders have sold shares recently.
The Importance Of Debt To Return On Equity
Most companies need money -- from somewhere -- to grow their profits. The cash for investment can come from prior year profits (retained earnings), issuing new shares, or borrowing. In the first and second cases, the ROE will reflect this use of cash for investment in the business. In the latter case, the debt used for growth will improve returns, but won't affect the total equity. In this manner the use of debt will boost ROE, even though the core economics of the business stay the same.
SS&C Technologies Holdings's Debt And Its 2.8% ROE
SS&C Technologies Holdings does use a significant amount of debt to increase returns. It has a debt to equity ratio of 1.71. Its ROE is quite low, even with the use of significant debt; that's not a good result, in my opinion. Investors should think carefully about how a company might perform if it was unable to borrow so easily, because credit markets do change over time.
In Summary
Return on equity is one way we can compare the business quality of different companies. In my book the highest quality companies have high return on equity, despite low debt. All else being equal, a higher ROE is better.
Having said that, while ROE is a useful indicator of business quality, you'll have to look at a whole range of factors to determine the right price to buy a stock. The rate at which profits are likely to grow, relative to the expectations of profit growth reflected in the current price, must be considered, too. So you might want to check this FREE visualization of analyst forecasts for the company.
Of course, you might find a fantastic investment by looking elsewhere. So take a peek at this free list of interesting companies.
We aim to bring you long-term focused research analysis driven by fundamental data. Note that our analysis may not factor in the latest price-sensitive company announcements or qualitative material.
If you spot an error that warrants correction, please contact the editor at editorial-team@simplywallst.com. This article by Simply Wall St is general in nature. It does not constitute a recommendation to buy or sell any stock, and does not take account of your objectives, or your financial situation. Simply Wall St has no position in the stocks mentioned. Thank you for reading.
