2 Key Clean Energy ETFs Face Off

Clean energy has been drawing investor attention for some time, with the category in recent years outperforming conventional energy, though it has lagged through most of 2021.
Right now, there are two well-established global ETFs that dominate the space: the $6.8 billion iShares Global Clean Energy ETF (ICLN) and the $2.1 billion Invesco WilderHill Clean Energy ETF (PBW). Both have well over a decade of trading history behind them, having launched in 2008 and 2005, respectively.
Performance & Trading
The first key point of differentiation is cost. While ICLN charges 0.42% in expense ratio, PBW charges 0.61%. And when it comes to trading, ICLN has an edge over PBW in most respects, with $104.24 million in average daily dollar volume and an average spread of 0.04%, or a penny.
Meanwhile, PBW’s average daily dollar volume is $32.46 million, while its spread is 0.13%, or 11 cents. However, PBW has a median tracking difference of 1.20%, meaning it has actually outperformed its index, while ICLN’s median tracking difference is -0.41%.
And PBW dominates ICLN easily in terms of performance. As of Nov. 22, it was up 10.86% over the one-month period versus ICLN’s 4.71%. Over three months, it was up 24.03% versus ICLN’s 10.62%. Year-to-date, PBW was down 11.44% versus ICLN’s 12.08% decline. It slipped a little for the one-year period, with a return of 10.34% versus ICLN’s return of 13.88%, but for the three-year period, PBW once again was in the lead, returning 59.37% versus ICLN’s 43.73%.


Courtesy of FactSet
Holdings
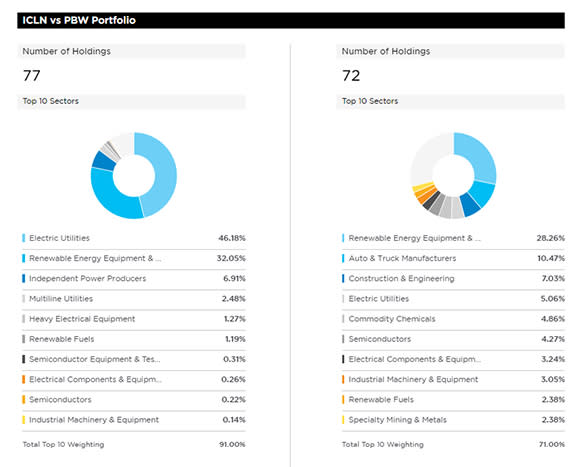
When it comes to holdings, ICLN has more securities, at 77, but prior to a methodology change for its index that took place last month, it held just 30. PBW has slightly fewer holdings, at 72. But the real difference is in the industry group allocations between the funds.
ICLN’s largest industry group is electric utilities, which it weights at a whopping 46.18%. Meanwhile, PBW’s largest industry group is renewable energy equipment and services, at 28.26%. Electric utilities have a weight of just 5.06% in PBW, while renewable energy equipment and services is ICLN’s second-largest industry group, at 32.05%. Clearly, ICLN is the more concentrated fund, and its third largest industry group has a weight of less than 7%.
But those aren’t the only differences. The top 10 industry groups are very different between the two funds. Auto and truck manufacturers is the second largest industry group in PBW, at 10.47%, but has no representation among ICLN’s top 10 industry groups.
Construction and engineering; commodity chemicals; and specialty mining and metals also have no representation in the top 10 industry groups for ICLN, but are among the key categories for PBW. Similarly, independent power producers, multiline utilities, heavy electrical equipment, and semiconductor equipment and testing are represented in the top 10 industry groups in PBW’s portfolio.
Courtesy of FactSet
(For a larger view, click on the image above)
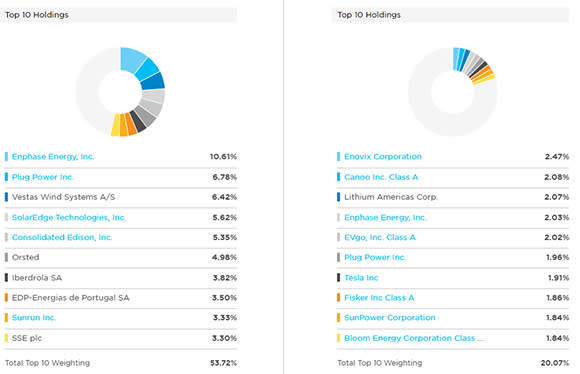
The top 10 securities holdings are just as differentiated. There is an overlap of only two companies in the funds’ top 10 holdings: Enphase Energy and Plug Power. Drilling down further, despite both funds having more than 70 individual holdings apiece, there is an overlap between the portfolios of just 20 funds. That overlap represents nearly 41% of ICLN’s portfolio and almost 31% of PBW’s portfolio. If one believes strongly in clean energy, there is an argument to be made for holding both funds.
(Check out ETF.com’s comparison tool to compare any two ETFs on a range of metrics.)
One item of note is that PBW has a nearly 2% weighting in Tesla, which does not appear in the portfolio of ICLN. Given the stock’s recent parabolic performance, it has no doubt played a role in PBW’s outperformance.
Courtesy of FactSet
(For a larger view, click on the image above)
Country Exposures
While both funds fall under the global renewable energy classification, PBW only invests in U.S.-listed securities, while ICLN takes a truly global approach. Unsurprisingly, the U.S. gets a nearly 84% weighting in PBW, but it has small exposures to other countries, including China, Canada, Chile and Hong Kong, among others.
The U.S. gets a weighting of 39% in ICLN, followed by a nearly 16% weighting to Denmark and a 6% weighting to Spain. Other countries holding prominent spots in its top 10 countries are Hong Kong, Canada, Portugal, Italy, the United Kingdom, Germany and Brazil. If you’re looking for diversified geographic exposure, ICLN is the hands-down winner in this pairing.
Factor Exposures
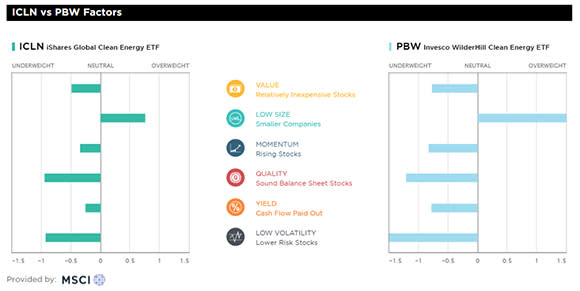
The funds have similar factor exposures, but it could be said that PBW’s are simply more intense.
For example, while one of ICLN’s largest overweight exposures is to low size, at 0.77, PBW’s exposure is at 2.10. ICLN has an underweight exposure to the quality factor of -0.94 versus -1.20 for PBW. And while ICLN has an underweight exposure of -0.92 to the low volatility factor, PBW has an exposure of -1.90. ICLN has negative exposures to value, momentum and yield, but in each case, PBW’s exposures are of even greater magnitude.
(For a larger view, click on the image above)
ESG Metrics
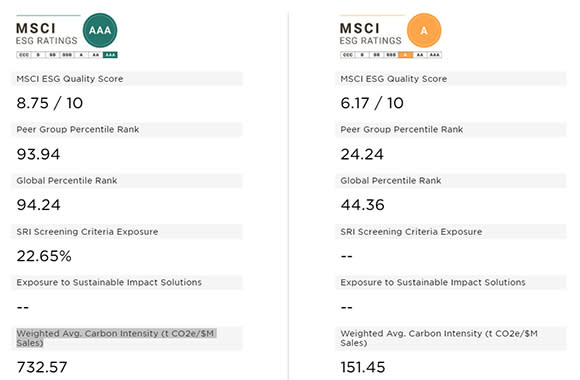
That said, ICLN outstrips PBW when it comes to ESG standing, and if an investor is interested in clean energy, that’s likely a key sticking point. The fund has an overall ESG rating from MSCI of AAA, which is the highest possible. However, PBW is no slacker, having an A rating from MSCI.
ICLN further has an ESG Quality Score from MSCI of 8.75 out of 10, while PBW has a score of 6.17. And ICLN has higher scores for both peer group ranking and global rankings, with nearly 94% of its peer companies scoring at or below the ETF. PBW’s ranking indicates more than 24% of its peers have a score that is equal to or below its score. Similarly, while ICLN’s global percentile ranking is 94.24, PBW’s is 44.36.
Strangely, ICLN has a weighted average carbon intensity score of 732.57, which means it generates nearly 733 tons of carbon dioxide emissions for every $1 million in sales. Meanwhile, PBW’s score for this metric is 151.45. ICLN’s heavy allocation to electric utilities could account for its rather outsized score.
Courtesy of MSCI
(For a larger view, click on the image above)
Conclusions
PBW has been consistent in its outperformance, which could have something to do with its significant exposure to the U.S. market, which has performed very well during the last decade or so, as well as its allocation to high-flyer Tesla. It also has a more diversified approach, moving beyond pure-play alternative energy companies to include those likely to benefit from the growth of clean energy.
That and its equal-weighted index likely account for its outperformance.
(Use our stock finder tool to find an ETF’s allocation to a certain stock.)
ICLN homes in more on producers of energy through alternative means, but it does include providers of technology and equipment. That said, its heavy industry concentrations may be part of what’s holding back its performance. And its heavy allocation to electric utilities could explain its level of carbon intensity.
For the environmentally conscious investor, PBW is likely the better choice. Despite ICLN receiving better ratings for overall ESG scores, PBW’s ratings in that area are perfectly respectable, and it exhibits far less carbon intensity than ICLN.
Contact Heather Bell at heather.bell@etf.com
Recommended Stories


