The 20 Hardest Places To Sell a Home

The housing market has done surprising things over the pandemic. When the economy took an especially tough hit, in 2020, the housing market did not follow suit. Mortgage rates hit all-time lows of below 3%, and buyers scrambled to lock in lower rates. This surge in demand drove home prices higher, making the market attractive to sellers.
This hot housing market hasn't slowed much by 2022, either, but that may be about to change. According to Yahoo, though March of 2022 was perhaps peak home sales, 12% of homes experienced reduced prices. The likely cause of this is rising interest rates, no longer so low, reaching 5.27% by May 5 -- which is actually the highest rate since the early 2000s.
SNAP 2022: Is My State Giving Out Extra EBT Food Stamp Money in June?
More: 10 Best Countries To Live on Just a Social Security Check
To help locate housing markets that may be in distress, GOBankingRates analyzed the 95 largest metropolitan housing markets according to Zillow's Housing Data and found the 20 hardest places to sell a home. Primary factors considered were the difference between list and sale prices, average price cut and average number of days on Zillow.
The resulting list of 20 cities is ranked in reverse order, with the most difficult city in which to sell a home listed last. Depending on your point of view, these cities could represent opportunities for buyers, as sellers that have a tough time getting their list price are likely to drop it. However, if sellers keep dropping their prices in a market, it can start a downward spiral, meaning your home price could fall below what you paid for it. Talking with a good local agent is a good place to start if you're looking to buy and want to get the temperature of a certain area.
Here are the cities in which it's hardest to sell a home.

20. Baltimore, Maryland
Median list price in 2022: $334,389
Median sale price in 2022: $324,833
Difference between list price and sale price: -$9,556
Average number of homes on the market in 2022: 6,023
Median days on market: 9
Percentage of listings with price cut: 11.96%
Median price cut in 2022: 3.16%

19. New Orleans, Louisiana
Median list price in 2022: $339,975
Median sale price in 2022: $257,278
Difference between list price and sale price: -$82,697
Average number of homes on the market in 2022: 1,780
Median days on market: 8
Percentage of listings with price cut: 12.42%
Median price cut in 2022: 3.12%

18. Hartford, Connecticut
Median list price in 2022: $368,834
Median sale price in 2022: $290,445
Difference between list price and sale price: -$78,389
Average number of homes on the market in 2022: 1,585
Median days on market: 13
Percentage of listings with price cut: 8.80%
Median price cut in 2022: 4.01%

17. Syracuse, New York
Median list price in 2022: $172,411
Median sale price in 2022: $170,695
Difference between list price and sale price: -$1,716
Average number of homes on the market in 2022: 986
Median days on market: 12
Percentage of listings with price cut: 9.24%
Median price cut in 2022: 4.57%
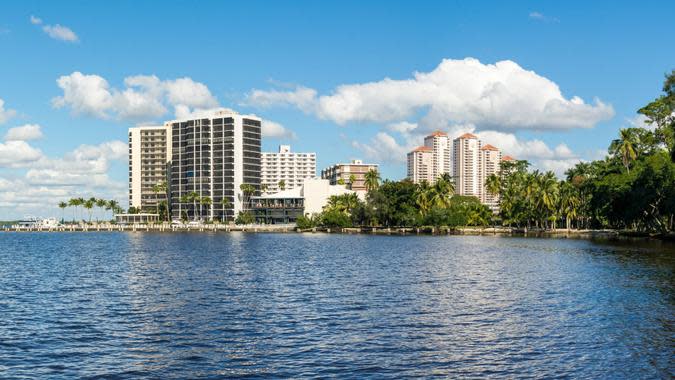
16. Fort Myers, Florida
Median list price in 2022: $485,828
Median sale price in 2022: $302,000
Difference between list price and sale price: -$183,828
Average number of homes on the market in 2022: 3,316
Median days on market: 10
Percentage of listings with price cut: 10.47%
Median price cut in 2022: 3.07%

15. Houston, Texas
Median list price in 2022: $379,358
Median sale price in 2022: $321,256
Difference between list price and sale price: -$58,102
Average number of homes on the market in 2022: 21,658
Median days on market: 13
Percentage of listings with price cut: 11%
Median price cut in 2022: 2.33%

14. Philadelphia, Pennsylvania
Median list price in 2022: $318,333
Median sale price in 2022: $290,666
Difference between list price and sale price: -$27,667
Average number of homes on the market in 2022: 13,582
Median days on market: 12
Percentage of listings with price cut: 11.44%
Median price cut in 2022: 3.17%

13. Miami-Fort Lauderdale, Florida
Median list price in 2022: $615,656
Median sale price in 2022: $459,889
Difference between list price and sale price: -$155,778
Average number of homes on the market in 2022: 12,162
Median days on market: 16
Percentage of listings with price cut: 8.09%
Median price cut in 2022: 3.17%

12. Toledo, Ohio
Median list price in 2022: $149,678
Median sale price in 2022: $144,939
Difference between list price and sale price: -$4,739
Average number of homes on the market in 2022: 1,135
Median days on market: 16
Percentage of listings with price cut: 9.40%
Median price cut in 2022: 4.55%

11. Detroit, Michigan
Median list price in 2022: $208,289
Median sale price in 2022: $228,944
Difference between list price and sale price: $20,655
Average number of homes on the market in 2022: 9,162
Median days on market: 10
Percentage of listings with price cut: 11.69%
Median price cut in 2022: 3.99%

10. Cleveland, Ohio
Median list price in 2022: $108,689
Median sale price in 2022: $187,094
Difference between list price and sale price: $6,406
Average number of homes on the market in 2022: 3,966
Median days on market: 11
Percentage of listings with price cut: 11.73%
Median price cut in 2022: 4.15%

9. New Haven, Connecticut
Median list price in 2022: $372,645
Median sale price in 2022: $302,889
Difference between list price and sale price: -$69,756
Average number of homes on the market in 2022: 1,172
Median days on market: 19
Percentage of listings with price cut: 8.58%
Median price cut in 2022: 4.10%

8. Akron, Ohio
Median list price in 2022: $169,978
Median sale price in 2022: $168,889
Difference between list price and sale price: -$1,089
Average number of homes on the market in 2022: 1,340
Median days on market: 10
Percentage of listings with price cut: 10.79%
Median price cut in 2022: 4.78%

7. Albany, New York
Median list price in 2022: $265,778
Median sale price in 2022: $224,589
Difference between list price and sale price: -$41,189
Average number of homes on the market in 2022: 1,145
Median days on market: 14
Percentage of listings with price cut: 10.36%
Median price cut in 2022: 4.43%
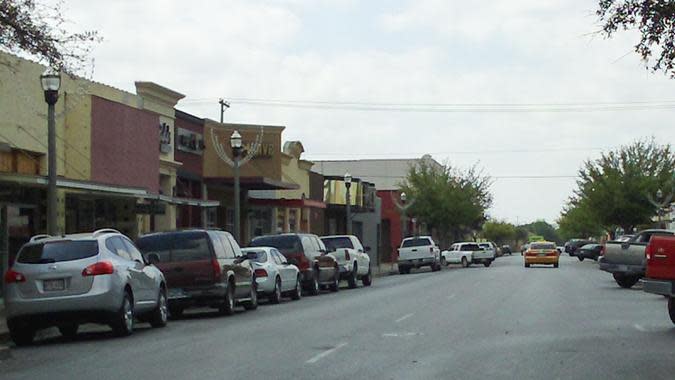
6. McAllen, Texas
Median list price in 2022: $259,889
Median sale price in 2022: $199,722
Difference between list price and sale price: -$60,166
Average number of homes on the market in 2022: 1,395
Median days on market: 32
Percentage of listings with price cut: 9.49%
Median price cut in 2022: 3.39%

5. Chicago, Illinois
Median list price in 2022: $323,666
Median sale price in 2022: $284,667
Difference between list price and sale price: -$38,999
Average number of homes on the market in 2022: 23,730
Median days on market: 18
Percentage of listings with price cut: 12.10%
Median price cut in 2022: 2.72%

4. Milwaukee, Wisconsin
Median list price in 2022: $191,689
Median sale price in 2022: $222,222
Difference between list price and sale price: 30,534
Average number of homes on the market in 2022: 2,427
Median days on market: 34
Percentage of listings with price cut: 9.53%
Median price cut in 2022: 4.01%

3. Pittsburgh, Pennsylvania
Median list price in 2022: $200,522
Median sale price in 2022: $200,322
Difference between list price and sale price: -$200
Average number of homes on the market in 2022: 4,926
Median days on market: 23
Percentage of listings with price cut: 12.54%
Median price cut in 2022: 4.06%

2. Stamford, Connecticut
Median list price in 2022: $962,422
Median sale price in 2022: $564,000
Difference between list price and sale price: -$398,422
Average number of homes on the market in 2022: 1,558
Median days on market: 31
Percentage of listings with price cut: 6.98%
Median price cut in 2022: 3.48%

1. New York, New York
Median list price in 2022: $657,400
Median sale price in 2022: $547,766
Difference between list price and sale price: -$109,634
Average number of homes on the market in 2022: 26,119
Median days on market: 37
Percentage of listings with price cut: 6.60%
Median price cut in 2022: 3.56%
More From GOBankingRates
Social Security: Women Get $354 Per Month Less Than Men - Here's Why
Looking To Diversify in a Bear Market? Consider These Alternative Investments
Jordan Rosenfeld contributed to the reporting for this article.
Methodology: GOBankingRates analyzed the 90 largest metropolitan housing markets for which Zillow provides complete data to find the 20 hardest places to sell a home. GOBankingRates first found the 2022 average median list price and 2022 average median sale price for homes in each metropolitan area by averaging Zillow's monthly estimates of each figure for January through March 2022. Then, GOBankingRates calculated the (1) typical difference between the list and sale price for homes in each area in 2022. GOBankingRates then similarly analyzed Zillow's monthly estimates of other housing market metrics to find each metro area's (2) average housing market inventory in 2022, (3) 2022 average median number of days homes spent on the market, (4) 2022 average share of listings that took a price cut while on the market and (5) 2022 average median price cut taken by homes on the market, measured as a percent of the prior list price. All cities were then scored against each other and ranked, with a larger difference between list and sale prices, larger housing market inventory, greater typical number of days spent on the market, greater share of listings taking a price cut, and larger price cuts taken indicating places where it is more difficult to sell a home. Zillow's smoothed estimates for single family residences were used for all metrics. In the calculation of final scores, factor (2) was weighted half as heavily as all other factors. All data was compiled on and up to date as of May 11, 2022.
This article originally appeared on GOBankingRates.com: The 20 Hardest Places To Sell a Home
