2U Inc (NASDAQ:TWOU): Does The -42.4% Earnings Decline Make It An Underperformer?

After looking at 2U Inc’s (NASDAQ:TWOU) latest earnings announcement (30 September 2017), I found it useful to revisit the company’s performance in the past couple of years and assess this against the most recent figures. As a long-term investor I tend to focus on earnings trend, rather than a single number at one point in time. Also, comparing it against an industry benchmark to understand whether it outperformed, or is simply riding an industry wave, is a crucial aspect. Below is a brief commentary on my key takeaways. View our latest analysis for 2U
How Well Did TWOU Perform?
I like to use data from the most recent 12 months, which either annualizes the most recent 6-month earnings update, or in some cases, the most recent annual report is already the latest available financial data. This method enables me to assess different stocks on a similar basis, using the most relevant data points. For 2U, its most recent earnings is -$32.1M, which compared to the previous year’s level, has become more negative. Given that these figures may be fairly nearsighted, I have estimated an annualized five-year figure for 2U’s net income, which stands at -$26.6M. This doesn’t seem to paint a better picture, as earnings seem to have gradually been getting more and more negative over time.
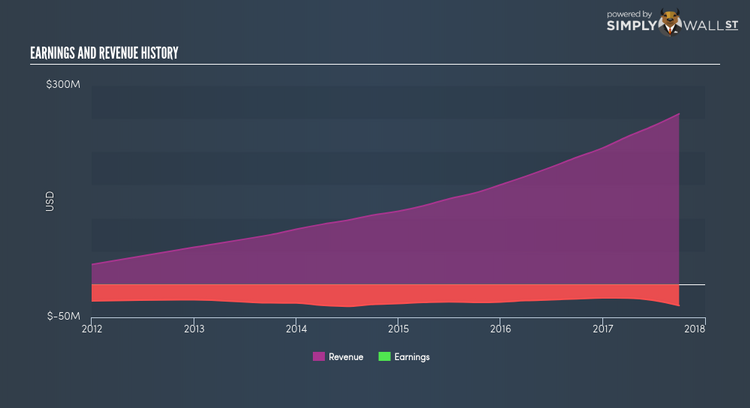
Additionally, we can evaluate 2U’s loss by looking at what’s going on in the industry as well as within the company. First, I want to quickly look into the line items. Revenue growth over the last few years has increased by 28.51%, implying that 2U is in a high-growth period with expenses racing ahead high top-line growth rates, leading to yearly losses. Inspecting growth from a sector-level, the US internet industry has been growing, albeit, at a subdued single-digit rate of 7.42% over the prior twelve months, and a substantial 15.52% over the previous few years. This means that whatever uplift the industry is benefiting from, 2U has not been able to reap as much as its industry peers.
What does this mean?
2U’s track record can be a valuable insight into its earnings performance, but it certainly doesn’t tell the whole story. With companies that are currently loss-making, it is always hard to predict what will occur going forward, and when. The most valuable step is to assess company-specific issues 2U may be facing and whether management guidance has dependably been met in the past. I recommend you continue to research 2U to get a better picture of the stock by looking at:
1. Future Outlook: What are well-informed industry analysts predicting for TWOU’s future growth? Take a look at our free research report of analyst consensus for TWOU’s outlook.
2. Financial Health: Is TWOU’s operations financially sustainable? Balance sheets can be hard to analyze, which is why we’ve done it for you. Check out our financial health checks here.
3. Other High-Performing Stocks: Are there other stocks that provide better prospects with proven track records? Explore our free list of these great stocks here.
NB: Figures in this article are calculated using data from the last twelve months, which refer to the 12-month period ending on the last date of the month the financial statement is dated. This may not be consistent with full year annual report figures.
To help readers see pass the short term volatility of the financial market, we aim to bring you a long-term focused research analysis purely driven by fundamental data. Note that our analysis does not factor in the latest price sensitive company announcements.
The author is an independent contributor and at the time of publication had no position in the stocks mentioned.
