3 Big Stock Charts for Thursday: Oracle, Salesforce and Union Pacific
The S&P 500 lost nearly 3% of its value yesterday, as an inversion of the yield curve convinced enough traders the risk of a recession is all too real. It remains to be seen if investors will continue to believe it, but the selloff to date still doesn’t qualify as a full-blown “correction.”

Source: Shutterstock
Macy’s (NYSE:M) led the way with its 13% plunge in response to a big earnings miss, underscored by warnings that tariffs were becoming problematic. Advanced Micro Devices (NASDAQ:AMD) fell 6%, as it was pegged as one of the more vulnerable names of a global economic slowdown.
Yet, there were some winners despite Wednesday’s misery. FireEye (NASDAQ:FEYE), for instance, gained nearly 3% for reasons investors are still trying to ferret out. Rival cybersecurity stocks didn’t fare any better than the broad market did on Wednesday.
InvestorPlace - Stock Market News, Stock Advice & Trading Tips
Headed into Thursday’s action, keep a close eye on the stock charts of Salesforce (NYSE:CRM), Oracle (NYSE:ORCL) and Union Pacific (NYSE:UNP). These names may make for your best trading bets.
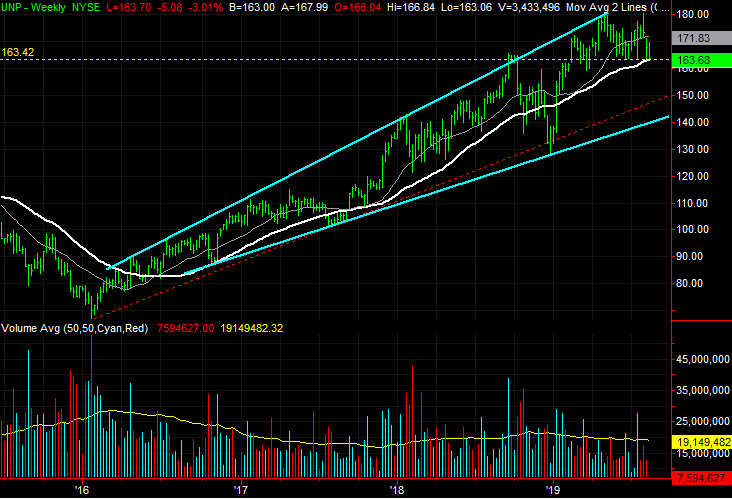
Union Pacific (UNP)
It ended up coming back from the brink of the start of a truly devastating breakdown thanks to yesterday’s late-session rally. But, Union Pacific shares remain uncomfortably close to that last-ditch line in the sand. If one more bad day is allowed to take shape, it could mean a key floor snaps and opens the floodgates. And, for the record, UNP shares are likely already fighting a losing battle for two (semi-related) reasons.
The good news is, the most plausible landing spots for any pullback are well defined.
The last-ditch line in the sand is $163.50, plotted in red on both stock charts. That’s where Union Pacific have found lows since June, and near where the white 200-day moving average line is now.
Zooming out to the weekly chart of UNP it becomes clear that the stock is being guided higher within the confines of bullish trend lines. The recent bump into the upper one sets the stage for a retreat back to the lower one, both marked in blue. (The red dashed line as an alternative floor.)
It’s not evident on the chart, but railroad traffic has been tepid this year, with traffic falling back below 2017’s and 2018’s levels.
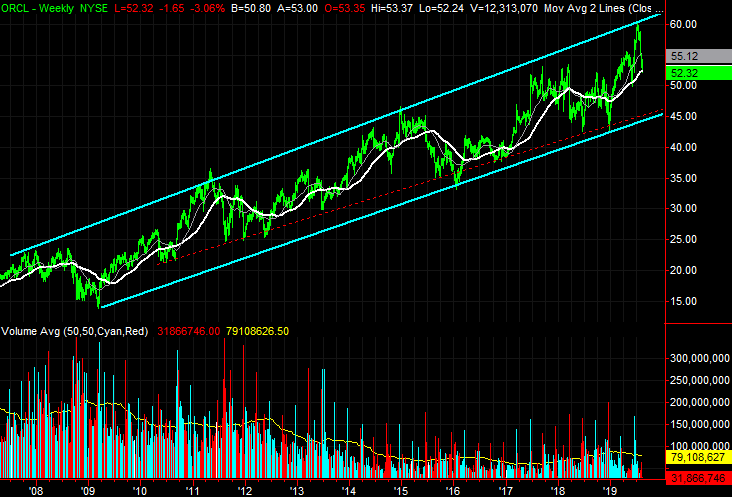
Oracle (ORCL)
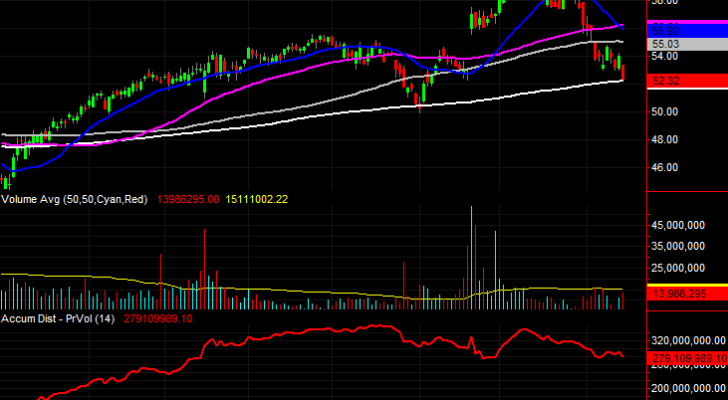
It has more to do with the broad market’s weakness than Oracle in particular. Nevertheless, the situation ORCL shares are in leaves them more vulnerable to major trouble than what most other stocks are facing at this time. And, the bears have already tipped what seems to be a pretty strong hand.
There’s also a great deal of similarity to the UNP stock chart. That is, Oracle shares are in a major, long-term uptrend but due for at least a small pullback to the lower edge of that trading channel.
As was the case with Union Pacific, Oracle’s long-term bullish trading range is marked with blue lines on the weekly chart. The other potential floor is plotted with a red dashed line. Both will be around $46 by the time they could be tested.
It’s not likely to be a coincidence that Wednesday’s selling was halted right at the 200-day moving average, plotted in white on both stock charts.
Although not decidedly bearish yet, notice there seems to be more bearish volume than not. The daily chart’s falling accumulation-distribution line quantifies that mostly qualitative idea.
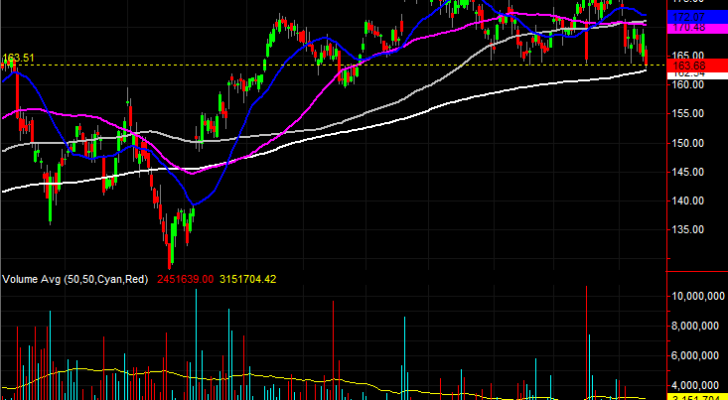
Salesforce (CRM)
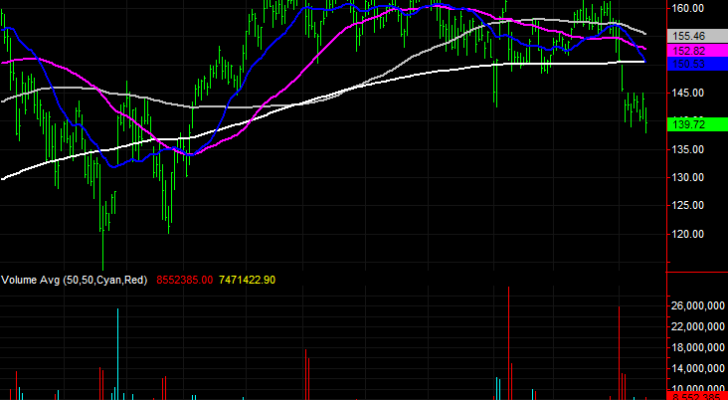
Finally, as far as breakdowns go, the line Salesforce has dished out since the beginning of this month has been sloppy to the point of being untrustworthy. That is to say, this usually choppy stock could easily, seemingly, snap back to a bullish mode with just the smallest bit of help from the broad market.
On the other hand, we’re seeing a few more subtle red flags now that we hadn’t seen in a long while. Things could get worse for owners before they get better.
The chief concern is the break below the 200-day moving average line, marked in white on both stock charts. Underscoring that potential problem is the fact that all other moving average lines are en-route to falling below the 200-day line as well.
Although we’ve seen volume spikes on bearish days before, we’ve not yet seen persistently bearish days with this much sustained selling volume.
With no other technical framework to point to likely landing spots, the next most likely floor is around $123.35, where the 38.2% Fibonacci retracement line awaits.

As of this writing, James Brumley did not hold a position in any of the aforementioned securities. You can learn more about him at his website jamesbrumley.com, or follow him on Twitter, at @jbrumley.
More From InvestorPlace
The post 3 Big Stock Charts for Thursday: Oracle, Salesforce and Union Pacific appeared first on InvestorPlace.
