3 Big Stock Charts for Thursday: Albemarle, Realty Income and CIGNA
Still digesting a respectable earnings report from Apple (NASDAQ:AAPL) as well as the Federal Reserve’s report card saying the economy was “strong” — but not strong enough to raise rates — it’s not terribly surprising a solid gain turned into a small loss on Wednesday.
The S&P 500 was up as much as 0.67% yesterday, but gave all of it back (and then some) to end the session 0.1% lower. Apple gained 5.9% for the session, and Sodastream International (NASDAQ:SODA) popped more than 26%, yet it wasn’t enough to overcome the performances of the likes of Caesars Entertainment (NASDAQ:CZR) or Chesapeake Energy (NYSE:CHK). The former fell nearly 15% on a lousy outlook despite a quarterly earnings beat, while the latter tumbled to the tune of 5.7% in response to a not-so-bad quarter. There were just far more falling stocks than rising ones.
Translation: It’s a stock-pickers market, even more so than usual.
InvestorPlace - Stock Market News, Stock Advice & Trading Tips
To that end, stocks charts of CIGNA (NYSE:CI), Realty Income (NYSE:O) and Albemarle (NYSE:ALB) are actually looking like the top trading prospects as Thursday’s action begins. They’re not compelling because they were wild movers on Wednesday, but rather because they quietly continued to work on trends that started to take shape days ago.
Here’s the deal.
Realty Income (O)

It’s not entirely clear if Realty Income shares are edging higher because the market simply sees more value ahead, or if it’s the countermove following an overdone selloff earlier in the year; it’s likely a little bit of both.
The underlying rationale is mostly irrelevant though. A trend in motion will remain in motion until something specific stops it. Indeed, Realty Income may be gearing up for a big breakout thrust.
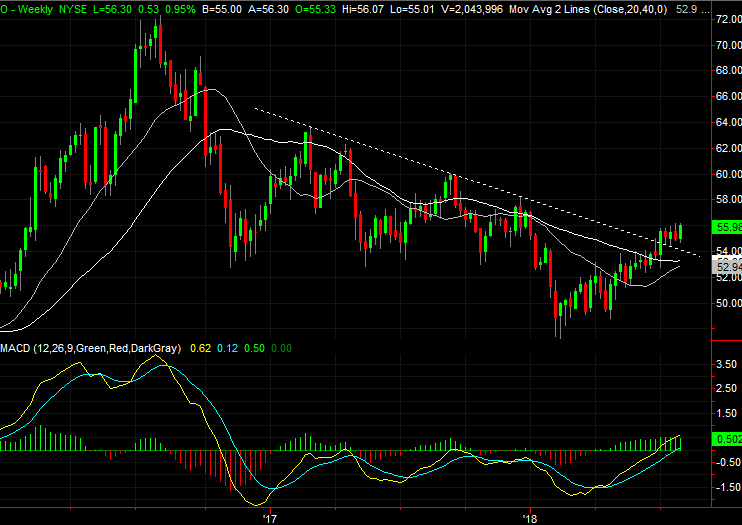
• The uptrend that has taken shape since late February was been well framed by support and resistance lines. Note, though, that recent support is forcing the stock to test the upper edge of the trading range, acting as if the bulls are mulling a break. If that happens, the resulting surge has little to stand in its way.
• The daily chart has also hurdled the 200-day moving average line (white).
• The ultimate underpinnings for the current advance is a break out of a downtrend evident on the weekly chart. The falling resistance line (dashed) was snapped a month ago, and the bulls haven’t hesitated to follow-through.
Albemarle (ALB)

Albemarle shares have been dancing with a breakdown for weeks, but thanks to Wednesday’s weakness are back to being on the verge of that meltdown. One more misstep could pop the already fragile balloon.
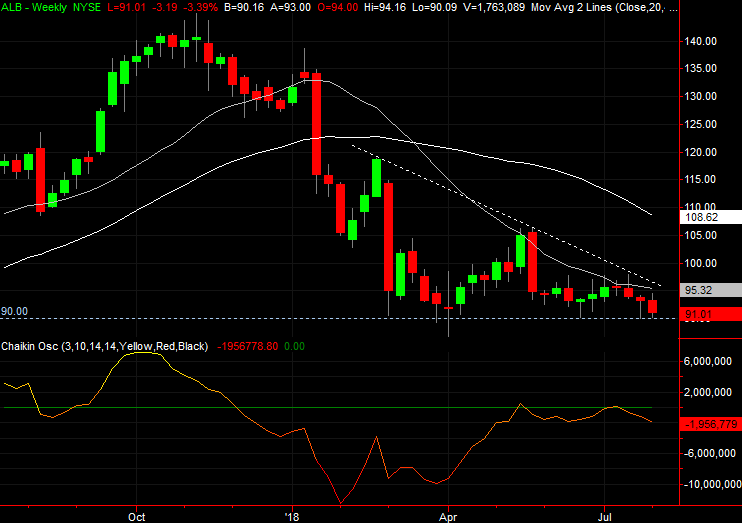
• The line in the sand is $90.30, where ALB has found a floor several times since March. But, the current test of that support is different than the others. This time around, the test is taking shape right after a failed effort to move above the 20-day and 50-day moving averages.
• Helping to bring the matter to a head is the way the broad trend has been forced lower since February’s high. There’s little room left for Albemarle to bounce around from here. It will have to break up or break down.
• There’s also more bearish volume than bullish volume at work, and has been since May. That leans in favor of a breakdown.
CIGNA (CI)

Last but not least, yesterday it was revealed that activist investors Carl Icahn had built — and would continue to build — a stake in CIGNA as part of an effort to prevent the company from a tie-up with Express Scripts (NASDAQ:ESRX). Icahn is concerned that the foray from Amazon.com (NASDAQ:AMZN) into the drug business could prove problematic.
The end result was a solid rally, but a retreat as the end of the day approached. The pullback, however, also materialized right where one would expect it to, making it unclear where the market stands right now. Though not worth trading just yet, the shape of the chart thus far suggests something big is brewing.
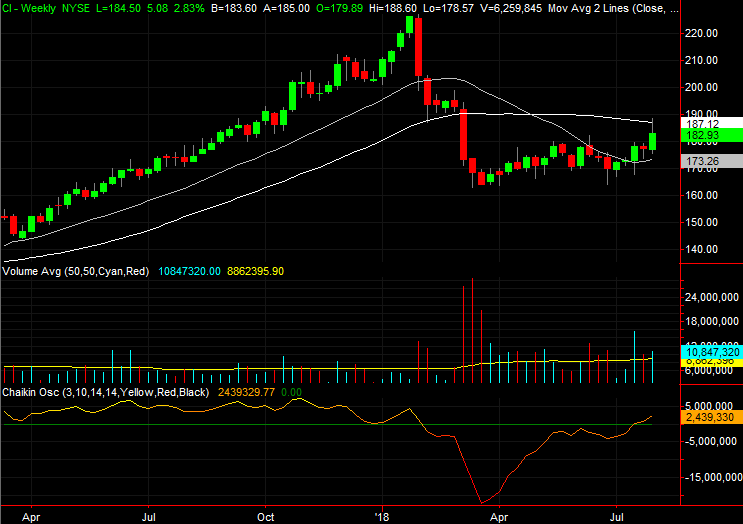
• CI shares rallied right up to the 200-day moving average line (white) as well as a rising resistance line. It can’t be surprising it was used as a spot to take profits. What’s not yet clear is if the shape of the chart also marks the beginning of a pivot back into a downtrend.
• The volume of late has been decidedly bullish, hinting that there are bulls waiting in the wings. The stock will need to clear the resistance around $188, though, for the bulls on the sidelines to get into the game.
• It could take several more days for the kind of clarity we want to become evident, but the prospective action is worth the wait.
As of this writing, James Brumley did not hold a position in any of the aforementioned securities. You can follow him on Twitter, at @jbrumley.
More From InvestorPlace
The post 3 Big Stock Charts for Thursday: Albemarle, Realty Income and CIGNA appeared first on InvestorPlace.
