3 Big Stock Charts for Thursday: PayPal, Nike and Micron Technology
Stocks logged their fourth winning day in the row, but also for the fourth day in a row, the progress was weaker than the prior day’s gain. Wednesday’s close of 2584.96 was only 0.41% better than Tuesday’s last trade, and the buying volume continued to fade.
Chesapeake Energy (NYSE:CHK) did much of the heavy lifting, gaining 12.9% in response to fourth-quarter production that was much greater than anticipated. Bed Bath & Beyond (NASDAQ:BBBY) made a nice showing as well, up 4.1% during the day’s regular session and then rallying more than 20% in after-hours action in response to a blowout fourth quarter.
Neither are worth stepping into at this point though, particularly with the broad market’s advance starting to slow. Rather, stock charts of PayPal Holdings (NASDAQ:PYPL), Micron Technology (NASDAQ:MU) and Nike (NYSE:NKE) are at key pivot points that could end up rewarding newcomers.
InvestorPlace - Stock Market News, Stock Advice & Trading Tips
Micron Technology (MU)
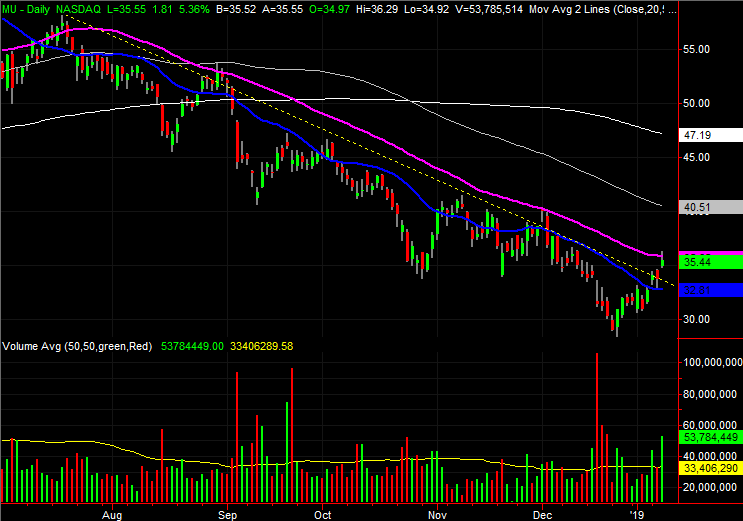
The latter part of 2018 was miserable for Micron Technology shareholders. The stock was cut in half in the shadow of a computer memory glut. Things started to change in late-December though. With some help from the market’s rising tide, MU shares started to inch higher. With just a quick glance it looks like this could be the long-awaited recovery.
The rally was halted at a suspicious level, however, and the stock may not be ready to really rebound just yet.
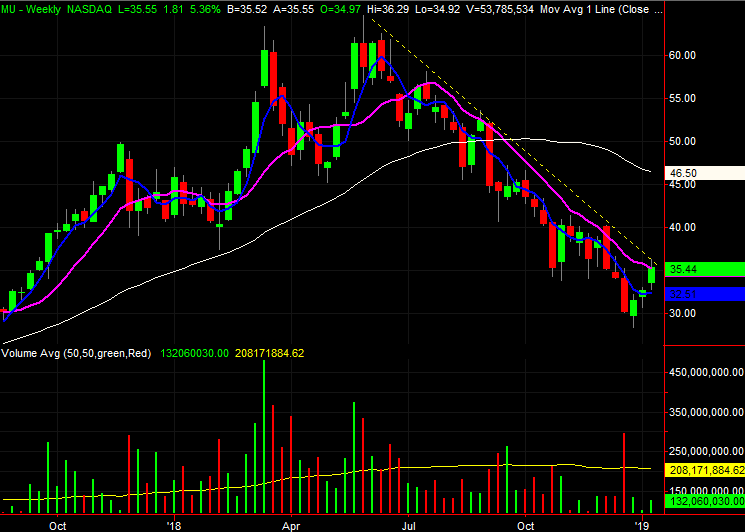
• The line in the sand to watch from here going forward is the 50-day moving average line, plotted in purple. The same line was a resistance level every time it was tested since August.
• The good news for the would-be buyers is, this test of the 50-day moving average line is different than prior ones have been. Namely, there’s been a couple of high volume gains this week. The buyers are out there, waiting.
PayPal Holdings (PYPL)
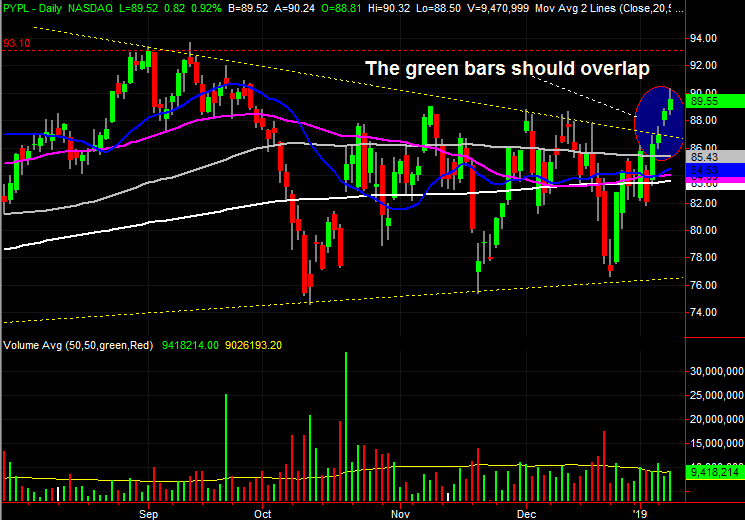
As of the end of last year, PayPal Holdings was trapped in a converging trading range. Though the shape of the chart set the stage for a strong move, it hadn’t developed yet.
That’s changed this week, though not ideally. Nevertheless, though the stock will have to pull back first before moving higher again, the bulls have tipped their hand.
• The shrinking trading range is plotted with yellow dashed lines on both stock charts. After a consolidation phase, PYPL popped out of that range on Tuesday and then followed through on Wednesday.
• Though a strong move, it may have been a little too strong. While there’s no gap between Monday’s high and Tuesday’s low, the stock did leave a gap on Tuesday’s open. Shares closed higher again yesterday, but traders weren’t boldly stepping in.
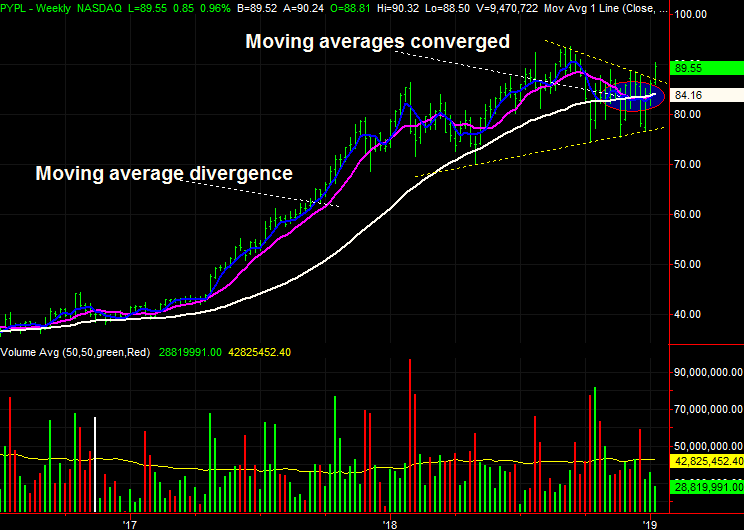
• Notice how all the key moving averages converged between October and this month. History shows that more often than not, we’ll now start to see those lines diverge again, driven by a move that has been pent-up since the middle of last year.
Nike (NKE)
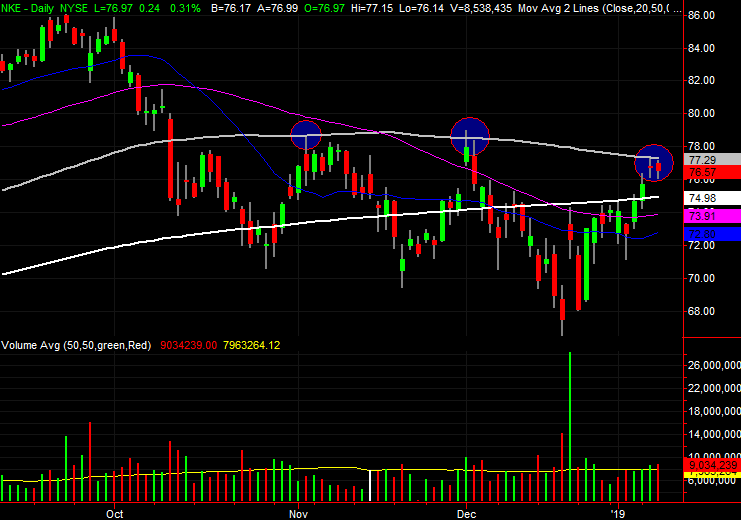
Finally, though it’s neither bullish nor bearish yet, it’s suspicious that Nike was unable to move higher on Wednesday even though the overall market ended up for the day. Even more suspicious is that for a second day in a row, the buyers were either unwilling or unable to get NKE shares over a key technical hump.
If the bears are going to pull the rug out from underneath shares, this is how and where they would do it.

• The technical hurdle is the 100-day moving average line, plotted in gray on both stock charts. The buying stopped there this week, as it did a couple of times last year.
• The shape of yesterday’s and Tuesday’s bar is also telling. Both are dojis, meaning the open and close are near one another, and in the middle of the day’s low-to-high range. These bars are often seen at pivot points, which in this case would be a pivot out of a bullish swing.
• Though a concern, the stall doesn’t necessarily preclude more bullishness. Indeed, it might actually set up a strong thrust by giving the bulls a brief brother. But, until the 100-day line is actually hurdled and/or the MACD lines on the weekly chart turn bullish, the risk of another pullback remains too much of a distinct possibility.
As of this writing, James Brumley did not hold a position in any of the aforementioned securities. You can follow him on Twitter, at @jbrumley.
More From InvestorPlace
The post 3 Big Stock Charts for Thursday: PayPal, Nike and Micron Technology appeared first on InvestorPlace.
