3 Big Stock Charts for Thursday: SunTrust Banks, Inc., Southern Co and Snap-on Incorporated
For a short while on Tuesday, stocks were crushing it. But, only for a short while. By the time the closing bell rang, traders were once again terrified, sending the S&P 500 lower to the tune of 0.86%. The close of 2699.63 was the lowest close all month, with the setback led by iQiyi (NASDAQ:IQ) — it closed 13% lower for the session.
The overall American tech sector was hit particularly hard. Advanced Micro Devices (NASDAQ:AMD) lead that charge with a loss of 3.4%, leading to a 1.7% stumble for the group overall.
Still, trading is done on a case-by-case basis, and right now the stock charts of SunTrust Banks (NYSE:STI), Southern Co (NYSE:SO) and Snap-on Incorporated (NYSE:SNA) each make a pretty compelling trading case.
InvestorPlace - Stock Market News, Stock Advice & Trading Tips
Big Stock Charts: SunTrust Banks, Inc. (STI)

Not only are most bank stocks struggling right now, many of them have made their way past a bearish tipping point. Not SunTrust Banks, though. That’s the best part about this blooming opportunity … there’s a lot of room ahead for more downside, if one more floor is broken.
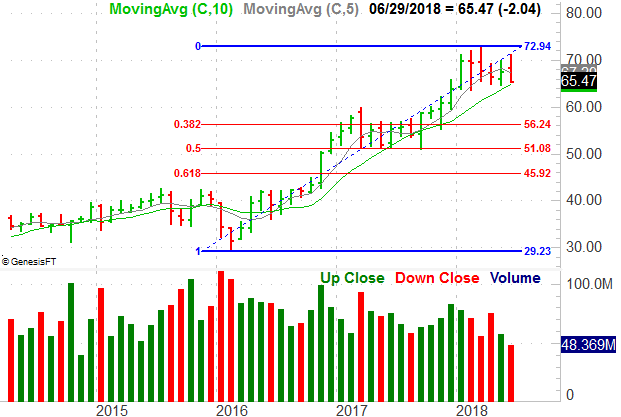
That floor is $64.86, where the 200-day moving average line is. That’s also where SunTrust shares hit a low several times since March.
There’s also been lots of volume behind the bearish days seen since May.
The most plausible downside targets are $56.24, $51.08 and $45.92, where key Fibonacci lines lie. The first two of those three levels also coincide with prior highs and lows, from the first half of 2017 when shares are trapped in a sideways range for quite some time.
Big Stock Charts: Southern Co (SO)

It’s just as much of a sector play as it is a company-specific trade. But, that doesn’t really matter. If Southern Co shares are rising because utility stocks are rising — as part of a flight to safety — then it’s rising for a reason that could last for the foreseeable future.
It’s just a happy coincidence that so many other bullish hints are falling into place.
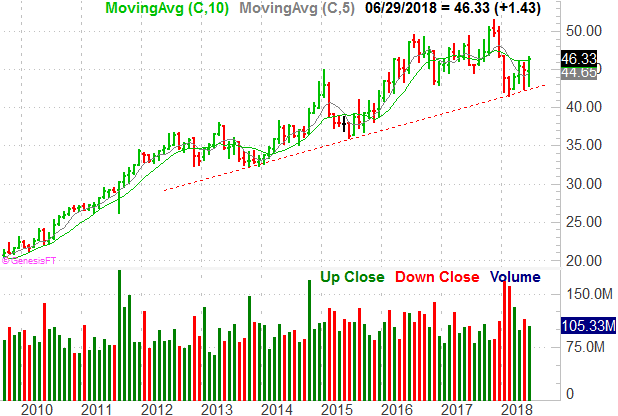
On Monday, SO shares hurdled their 200-day moving average line, and then found support at it in the meantime.
The bottom made in early June is actually part of a push-off of a rising support line that extends all the way back to late-2013.
If the overall market continues to struggle, the bullish undertow for utilities should persist.
Big Stock Charts: Snap-on Incorporated (SNA)

Last but not least, though any stock that managed to make forward progress against Wednesday’s bearish tide is impressive, that’s not the only thing that makes Snap-on Incorporated so interesting here. It’s the context of the gain that solidifies the bullish case.
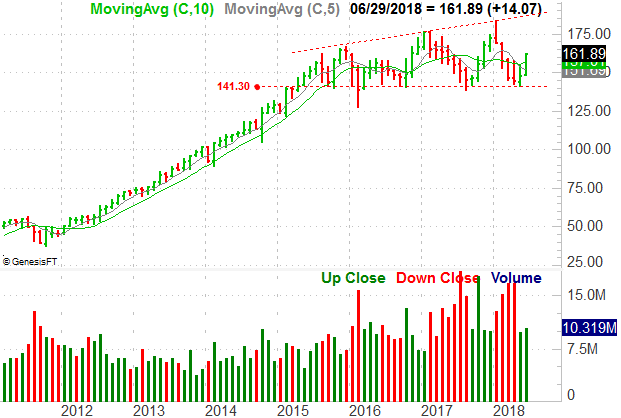
SNA shares have recently crossed above their 200-day moving average line, and though the market tide has been pointed lower for the past couple of weeks, the bulls here have been testing the waters of higher highs.
There’s also been lots of bullish volume behind the “up” days of late, while the losses have been on tepid volume. The Chaikin line’s move above the zero level to multi-week highs says this movement has some strong backing.
The bullish swing seen over the course of the past couple of weeks is ultimately feeding off of a strong horizontal support line at $141.30. It’s been verified several times since 2015. The upper side of this expanding trading range is currently at $186, but rising quickly.
As of this writing, James Brumley did not hold a position in any of the aforementioned securities. You can follow him on Twitter, at @jbrumley.
More From InvestorPlace
The post 3 Big Stock Charts for Thursday: SunTrust Banks, Inc., Southern Co and Snap-on Incorporated appeared first on InvestorPlace.
