With 31% ownership, VTEX (NYSE:VTEX) insiders have a lot at stake
Key Insights
Insiders appear to have a vested interest in VTEX's growth, as seen by their sizeable ownership
The top 4 shareholders own 57% of the company
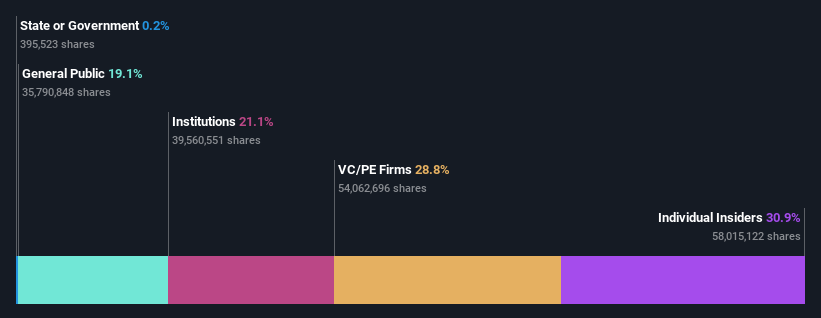
To get a sense of who is truly in control of VTEX (NYSE:VTEX), it is important to understand the ownership structure of the business. And the group that holds the biggest piece of the pie are individual insiders with 31% ownership. Put another way, the group faces the maximum upside potential (or downside risk).
With such a notable stake in the company, insiders would be highly incentivised to make value accretive decisions.
Let's delve deeper into each type of owner of VTEX, beginning with the chart below.
See our latest analysis for VTEX
What Does The Institutional Ownership Tell Us About VTEX?
Institutional investors commonly compare their own returns to the returns of a commonly followed index. So they generally do consider buying larger companies that are included in the relevant benchmark index.
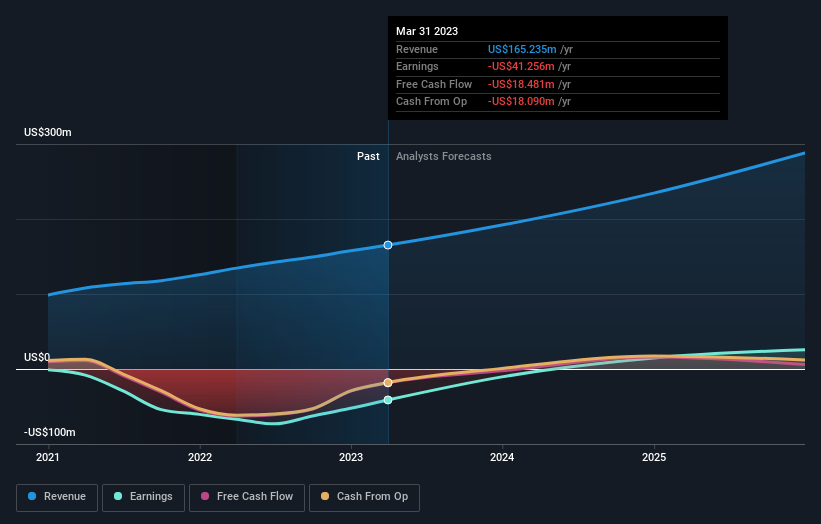
VTEX already has institutions on the share registry. Indeed, they own a respectable stake in the company. This suggests some credibility amongst professional investors. But we can't rely on that fact alone since institutions make bad investments sometimes, just like everyone does. If multiple institutions change their view on a stock at the same time, you could see the share price drop fast. It's therefore worth looking at VTEX's earnings history below. Of course, the future is what really matters.
VTEX is not owned by hedge funds. Looking at our data, we can see that the largest shareholder is SBLA Advisers Corp. with 20% of shares outstanding. In comparison, the second and third largest shareholders hold about 17% and 11% of the stock. Note that the second and third-largest shareholders are also Co-Chief Executive Officer and Co-Chairman of the Board, respectively, meaning that the company's top shareholders are insiders.
To make our study more interesting, we found that the top 4 shareholders control more than half of the company which implies that this group has considerable sway over the company's decision-making.
While it makes sense to study institutional ownership data for a company, it also makes sense to study analyst sentiments to know which way the wind is blowing. There are plenty of analysts covering the stock, so it might be worth seeing what they are forecasting, too.
Insider Ownership Of VTEX
The definition of company insiders can be subjective and does vary between jurisdictions. Our data reflects individual insiders, capturing board members at the very least. Management ultimately answers to the board. However, it is not uncommon for managers to be executive board members, especially if they are a founder or the CEO.
I generally consider insider ownership to be a good thing. However, on some occasions it makes it more difficult for other shareholders to hold the board accountable for decisions.
It seems insiders own a significant proportion of VTEX. Insiders own US$236m worth of shares in the US$764m company. We would say this shows alignment with shareholders, but it is worth noting that the company is still quite small; some insiders may have founded the business. You can click here to see if those insiders have been buying or selling.
General Public Ownership
The general public, who are usually individual investors, hold a 19% stake in VTEX. While this size of ownership may not be enough to sway a policy decision in their favour, they can still make a collective impact on company policies.
Private Equity Ownership
With a stake of 29%, private equity firms could influence the VTEX board. Sometimes we see private equity stick around for the long term, but generally speaking they have a shorter investment horizon and -- as the name suggests -- don't invest in public companies much. After some time they may look to sell and redeploy capital elsewhere.
Next Steps:
It's always worth thinking about the different groups who own shares in a company. But to understand VTEX better, we need to consider many other factors.
I like to dive deeper into how a company has performed in the past. You can find historic revenue and earnings in this detailed graph.
If you would prefer discover what analysts are predicting in terms of future growth, do not miss this free report on analyst forecasts.
NB: Figures in this article are calculated using data from the last twelve months, which refer to the 12-month period ending on the last date of the month the financial statement is dated. This may not be consistent with full year annual report figures.
Have feedback on this article? Concerned about the content? Get in touch with us directly. Alternatively, email editorial-team (at) simplywallst.com.
This article by Simply Wall St is general in nature. We provide commentary based on historical data and analyst forecasts only using an unbiased methodology and our articles are not intended to be financial advice. It does not constitute a recommendation to buy or sell any stock, and does not take account of your objectives, or your financial situation. We aim to bring you long-term focused analysis driven by fundamental data. Note that our analysis may not factor in the latest price-sensitive company announcements or qualitative material. Simply Wall St has no position in any stocks mentioned.
Join A Paid User Research Session
You’ll receive a US$30 Amazon Gift card for 1 hour of your time while helping us build better investing tools for the individual investors like yourself. Sign up here
