ActiveOps Plc's (LON:AOM) Stock Has Shown Weakness Lately But Financial Prospects Look Decent: Is The Market Wrong?
With its stock down 14% over the past three months, it is easy to disregard ActiveOps (LON:AOM). However, stock prices are usually driven by a company’s financials over the long term, which in this case look pretty respectable. Particularly, we will be paying attention to ActiveOps' ROE today.
Return on equity or ROE is a key measure used to assess how efficiently a company's management is utilizing the company's capital. In simpler terms, it measures the profitability of a company in relation to shareholder's equity.
View our latest analysis for ActiveOps
How Is ROE Calculated?
Return on equity can be calculated by using the formula:
Return on Equity = Net Profit (from continuing operations) ÷ Shareholders' Equity
So, based on the above formula, the ROE for ActiveOps is:
1.5% = UK£116k ÷ UK£8.0m (Based on the trailing twelve months to September 2023).
The 'return' refers to a company's earnings over the last year. One way to conceptualize this is that for each £1 of shareholders' capital it has, the company made £0.01 in profit.
What Has ROE Got To Do With Earnings Growth?
We have already established that ROE serves as an efficient profit-generating gauge for a company's future earnings. Based on how much of its profits the company chooses to reinvest or "retain", we are then able to evaluate a company's future ability to generate profits. Generally speaking, other things being equal, firms with a high return on equity and profit retention, have a higher growth rate than firms that don’t share these attributes.
A Side By Side comparison of ActiveOps' Earnings Growth And 1.5% ROE
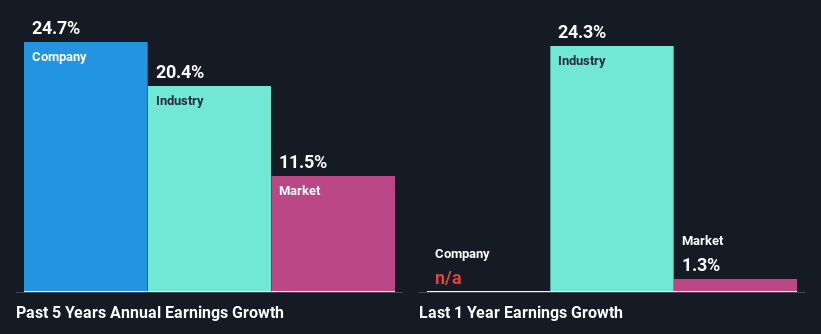
It is hard to argue that ActiveOps' ROE is much good in and of itself. Even when compared to the industry average of 8.3%, the ROE figure is pretty disappointing. Despite this, surprisingly, ActiveOps saw an exceptional 25% net income growth over the past five years. We reckon that there could be other factors at play here. Such as - high earnings retention or an efficient management in place.
Next, on comparing with the industry net income growth, we found that ActiveOps' growth is quite high when compared to the industry average growth of 20% in the same period, which is great to see.
Earnings growth is an important metric to consider when valuing a stock. What investors need to determine next is if the expected earnings growth, or the lack of it, is already built into the share price. This then helps them determine if the stock is placed for a bright or bleak future. One good indicator of expected earnings growth is the P/E ratio which determines the price the market is willing to pay for a stock based on its earnings prospects. So, you may want to check if ActiveOps is trading on a high P/E or a low P/E, relative to its industry.
Is ActiveOps Making Efficient Use Of Its Profits?
ActiveOps doesn't pay any dividend to its shareholders, meaning that the company has been reinvesting all of its profits into the business. This is likely what's driving the high earnings growth number discussed above.
Summary
In total, it does look like ActiveOps has some positive aspects to its business. Even in spite of the low rate of return, the company has posted impressive earnings growth as a result of reinvesting heavily into its business. That being so, according to the latest industry analyst forecasts, the company's earnings are expected to shrink in the future. To know more about the company's future earnings growth forecasts take a look at this free report on analyst forecasts for the company to find out more.
Have feedback on this article? Concerned about the content? Get in touch with us directly. Alternatively, email editorial-team (at) simplywallst.com.
This article by Simply Wall St is general in nature. We provide commentary based on historical data and analyst forecasts only using an unbiased methodology and our articles are not intended to be financial advice. It does not constitute a recommendation to buy or sell any stock, and does not take account of your objectives, or your financial situation. We aim to bring you long-term focused analysis driven by fundamental data. Note that our analysis may not factor in the latest price-sensitive company announcements or qualitative material. Simply Wall St has no position in any stocks mentioned.
