AdvanSix Inc (NYSE:ASIX) Delivered A Better ROE Than The Industry, Here’s Why

This analysis is intended to introduce important early concepts to people who are starting to invest and want a simplistic look at the return on AdvanSix Inc (NYSE:ASIX) stock.
With an ROE of 33.60%, AdvanSix Inc (NYSE:ASIX) outpaced its own industry which delivered a less exciting 13.93% over the past year. On the surface, this looks fantastic since we know that ASIX has made large profits from little equity capital; however, ROE doesn’t tell us if management have borrowed heavily to make this happen. In this article, we’ll closely examine some factors like financial leverage to evaluate the sustainability of ASIX’s ROE. Check out our latest analysis for AdvanSix
What you must know about ROE
Return on Equity (ROE) is a measure of AdvanSix’s profit relative to its shareholders’ equity. It essentially shows how much the company can generate in earnings given the amount of equity it has raised. In most cases, a higher ROE is preferred; however, there are many other factors we must consider prior to making any investment decisions.
Return on Equity = Net Profit ÷ Shareholders Equity
Returns are usually compared to costs to measure the efficiency of capital. AdvanSix’s cost of equity is 9.41%. Since AdvanSix’s return covers its cost in excess of 24.20%, its use of equity capital is efficient and likely to be sustainable. Simply put, AdvanSix pays less for its capital than what it generates in return. ROE can be split up into three useful ratios: net profit margin, asset turnover, and financial leverage. This is called the Dupont Formula:
Dupont Formula
ROE = profit margin × asset turnover × financial leverage
ROE = (annual net profit ÷ sales) × (sales ÷ assets) × (assets ÷ shareholders’ equity)
ROE = annual net profit ÷ shareholders’ equity
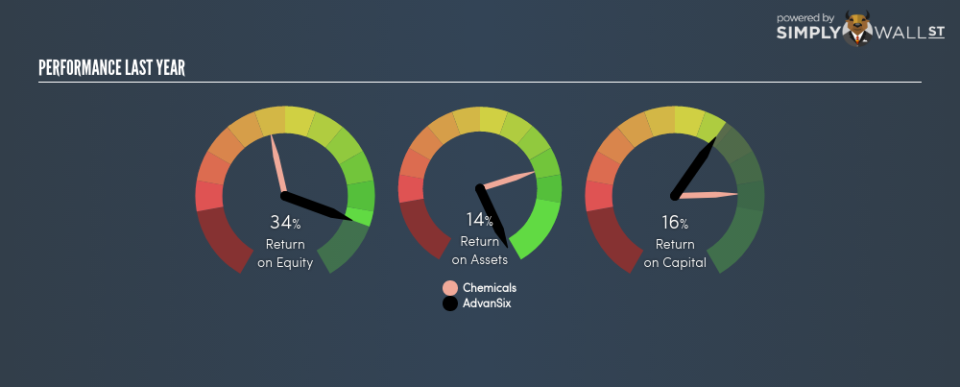
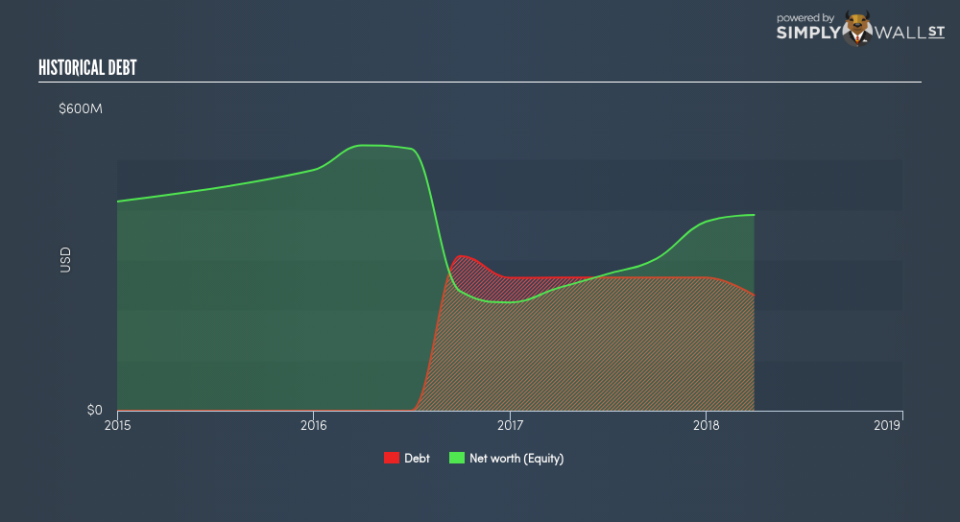
The first component is profit margin, which measures how much of sales is retained after the company pays for all its expenses. The other component, asset turnover, illustrates how much revenue AdvanSix can make from its asset base. And finally, financial leverage is simply how much of assets are funded by equity, which exhibits how sustainable the company’s capital structure is. Since ROE can be artificially increased through excessive borrowing, we should check AdvanSix’s historic debt-to-equity ratio. The debt-to-equity ratio currently stands at a sensible 59.00%, meaning the above-average ROE is due to its capacity to produce profit growth without a huge debt burden.
Next Steps:
ROE is one of many ratios which meaningfully dissects financial statements, which illustrates the quality of a company. AdvanSix’s ROE is impressive relative to the industry average and also covers its cost of equity. Its high ROE is not likely to be driven by high debt. Therefore, investors may have more confidence in the sustainability of this level of returns going forward. Although ROE can be a useful metric, it is only a small part of diligent research.
For AdvanSix, I’ve put together three fundamental aspects you should further research:
Financial Health: Does it have a healthy balance sheet? Take a look at our free balance sheet analysis with six simple checks on key factors like leverage and risk.
Valuation: What is AdvanSix worth today? Is the stock undervalued, even when its growth outlook is factored into its intrinsic value? The intrinsic value infographic in our free research report helps visualize whether AdvanSix is currently mispriced by the market.
Other High-Growth Alternatives : Are there other high-growth stocks you could be holding instead of AdvanSix? Explore our interactive list of stocks with large growth potential to get an idea of what else is out there you may be missing!
To help readers see pass the short term volatility of the financial market, we aim to bring you a long-term focused research analysis purely driven by fundamental data. Note that our analysis does not factor in the latest price sensitive company announcements.
The author is an independent contributor and at the time of publication had no position in the stocks mentioned.
