Agilent (A) Q1 Earnings & Revenues Beat Estimates, Dip Y/Y
Agilent Technologies A delivered first-quarter fiscal 2024 earnings of $1.29 per share, which beat the Zacks Consensus Estimate by 6.6%. However, the bottom line decreased 6% from the year-ago quarter.
Revenues of $1.66 billion surpassed the Zacks Consensus Estimate of $1.57 billion. However, the top line declined 5.6% on a reported basis and 6.4% on a core basis from the year-ago quarter’s levels.
The decline was attributed to broad-based weakness across all end markets, especially in Pharma, Chemistry & Advanced Materials, Food, and Diagnostics and Clinical markets.
Weak momentum in China was another major concern.
Agilent Technologies, Inc. Price, Consensus and EPS Surprise
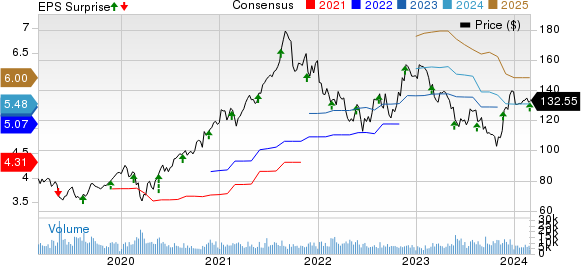
Agilent Technologies, Inc. price-consensus-eps-surprise-chart | Agilent Technologies, Inc. Quote
Segmental Top-Line Details
Agilent has three reporting segments — Life Sciences & Applied Markets Group (“LSAG”), Agilent Cross Lab Group (“ACG”) and Diagnostics and Genomics Group (“DGG”).
LSAG: The segment accounted for $846 million or 51% of the company’s total revenues, down 10% on a reported basis and 11% on a core basis from the prior-year quarter. This was due to macroeconomic uncertainties, and sluggish capital equipment spending by customers. The reported figure missed the Zacks Consensus Estimate of $849 million.
Nevertheless, the company witnessed strength in applied markets and consumables.
ACG: Revenues from the segment were $405 million, accounting for 24% of the total revenues. The figure surpassed the consensus mark of $385 million. The top line improved 6% from the prior-year quarter on a reported basis and rose 5% on a core basis, demonstrating solid momentum across all end markets and regions, except for China. Strength in enterprise service contracts, which drove growth in contract revenues, remained another positive.
DGG: Revenues decreased 6% from the prior-year quarter on a reported and core basis to $407 million, accounting for the remaining 25% of the total revenues. The figure beat the consensus mark of $332 million. Sluggishness in NGS reagents and increased clinical business mix at NASD were concerning.
Nevertheless, strength in the pathology business was a positive.
Operating Results
For the fiscal first quarter, the gross margin in the LSAG segment contracted by 130 basis points (bps) to 60.2% from the prior-year quarter. ACG’s gross margin expanded by 200 bps to 50.5%. DGG’s gross margin expanded by 20 bps from the year-ago quarter to 52.8%.
Research and development (“R&D”) costs were $128 million, up 4.1% from the prior-year quarter. Selling, general and administrative (“SG&A”) expenses were $396 million, down 5.5% from the year-earlier quarter. As a percentage of revenues, R&D expenses expanded by 70 bps year over year to 7.7%, while SG&A expenses remained flat year over year at 23.9%.
The operating margin for the fiscal first quarter was 23.2%, which contracted 110 bps from the year-earlier quarter.
Segment-wise, the operating margin in the LSAG segment contracted by 390 bps to 27.9% from the prior-year quarter. ACG’s operating margin expanded by 320 bps to 30.2%. DGG’s operating margin expanded by 40 bps from the year-ago quarter to 17.3%.
Balance Sheet & Cash Flow
As of Jan 31, 2024, Agilent’s cash and cash equivalents were $1.75 billion, up from $1.59 billion as of Oct 31, 2023.
Accounts receivables were $1.295 billion at the end of first-quarter fiscal 2024 compared with $1.291 billion at the end of fourth-quarter fiscal 2023.
Long-term debt was $2.555 billion for the reported quarter, down from $2.735 billion in the prior quarter.
Agilent generated $485 million in cash from operations in the reported quarter, down from $516 million in the previous quarter.
The company made dividend payments worth $69 million in the fiscal first quarter.
Guidance
For the second quarter of fiscal 2024, management expects revenues of $1.560-$1.590 billion, suggesting a decline of 9.1-7.4% on a reported basis and 8.4-6.7% on a core basis from the year-ago quarter. The Zacks Consensus Estimate for the same is pegged at $1.61 billion.
Non-GAAP earnings per share are expected to be $1.17-$1.20. The consensus mark for fiscal second-quarter earnings is pinned at $1.27 per share.
For fiscal 2024, management expects revenues of $6.710-$6.810 billion, implying a fall of 1.8-0.3% on a reported basis from the fiscal 2023 reported figure. The Zacks Consensus Estimate for the same is pegged at $6.74 billion.
Fiscal 2024 non-GAAP earnings per share are projected to be $5.44-$5.55. The consensus mark for fiscal 2024 earnings is pinned at $5.48 per share.
Zacks Rank & Other Stocks to Consider
Currently, Agilent carries a Zacks Rank #2 (Buy).
Some other top-ranked stocks in the broader technology sector are NVIDIA NVDA, BILL Holdings BILL and CrowdStrike CRWD, each sporting a Zacks Rank #1 (Strong Buy) at present. You can see the complete list of today’s Zacks #1 Rank stocks here.
NVIDIA shares have returned 59% year to date. The long-term earnings growth rate for NVDA is projected at 29.73%.
Shares of BILL Holdings have lost 20.9% in the year-to-date period. BILL’s long-term earnings growth rate is projected at 23.64%.
Shares of CrowdStrike have gained 25.8% in the year-to-date period. The long-term earnings growth rate for CRWD is projected at 36.07%.
Want the latest recommendations from Zacks Investment Research? Today, you can download 7 Best Stocks for the Next 30 Days. Click to get this free report
NVIDIA Corporation (NVDA) : Free Stock Analysis Report
Agilent Technologies, Inc. (A) : Free Stock Analysis Report
CrowdStrike (CRWD) : Free Stock Analysis Report
BILL Holdings, Inc. (BILL) : Free Stock Analysis Report
