The Aliaxis (EBR:094124352) Share Price Is Down 35% So Some Shareholders Are Getting Worried

One of the frustrations of investing is when a stock goes down. But when the market is down, you're bound to have some losers. The Aliaxis SA (EBR:094124352) is down 35% over three years, but the total shareholder return is -31% once you include the dividend. And that total return actually beats the market decline of 33%. And over the last year the share price fell 31%, so we doubt many shareholders are delighted. Furthermore, it's down 17% in about a quarter. That's not much fun for holders. But this could be related to the weak market, which is down 24% in the same period.
View our latest analysis for Aliaxis
To paraphrase Benjamin Graham: Over the short term the market is a voting machine, but over the long term it's a weighing machine. One imperfect but simple way to consider how the market perception of a company has shifted is to compare the change in the earnings per share (EPS) with the share price movement.
During the unfortunate three years of share price decline, Aliaxis actually saw its earnings per share (EPS) improve by 23% per year. This is quite a puzzle, and suggests there might be something temporarily buoying the share price. Alternatively, growth expectations may have been unreasonable in the past.
It's worth taking a look at other metrics, because the EPS growth doesn't seem to match with the falling share price.
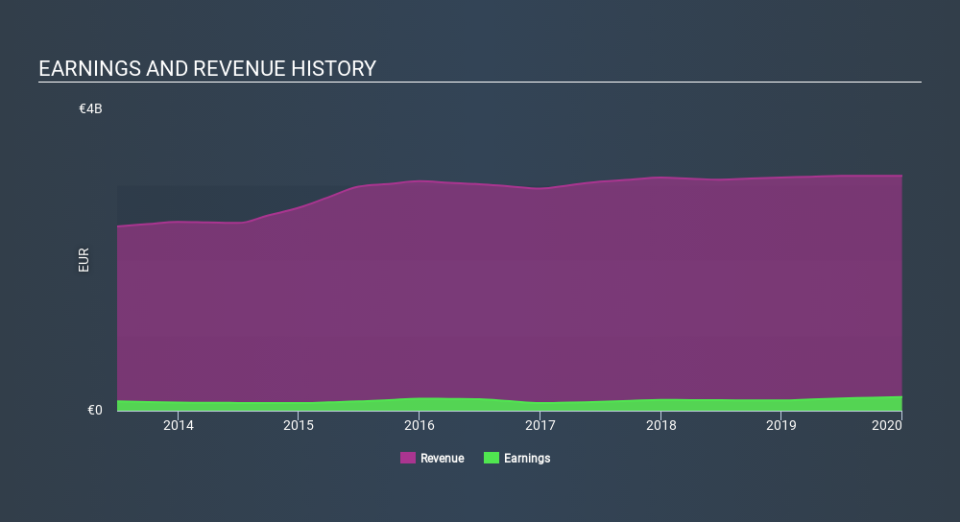
With revenue flat over three years, it seems unlikely that the share price is reflecting the top line. There doesn't seem to be any clear correlation between the fundamental business metrics and the share price. That could mean that the stock was previously overrated, or it could spell opportunity now.
You can see how earnings and revenue have changed over time in the image below (click on the chart to see the exact values).
Take a more thorough look at Aliaxis's financial health with this free report on its balance sheet.
What About Dividends?
When looking at investment returns, it is important to consider the difference between total shareholder return (TSR) and share price return. Whereas the share price return only reflects the change in the share price, the TSR includes the value of dividends (assuming they were reinvested) and the benefit of any discounted capital raising or spin-off. It's fair to say that the TSR gives a more complete picture for stocks that pay a dividend. As it happens, Aliaxis's TSR for the last 3 years was -31%, which exceeds the share price return mentioned earlier. And there's no prize for guessing that the dividend payments largely explain the divergence!
A Different Perspective
Aliaxis shareholders are down 29% for the year (even including dividends) , falling short of the market return. Meanwhile, the broader market slid about 24%, likely weighing on the stock. Shareholders have lost 12% per year over the last three years, so the share price drop has become steeper, over the last year; a potential symptom of as yet unsolved challenges. We would be wary of buying into a company with unsolved problems, although some investors will buy into struggling stocks if they believe the price is sufficiently attractive. It's always interesting to track share price performance over the longer term. But to understand Aliaxis better, we need to consider many other factors. For instance, we've identified 1 warning sign for Aliaxis that you should be aware of.
If you are like me, then you will not want to miss this free list of growing companies that insiders are buying.
Please note, the market returns quoted in this article reflect the market weighted average returns of stocks that currently trade on BE exchanges.
If you spot an error that warrants correction, please contact the editor at editorial-team@simplywallst.com. This article by Simply Wall St is general in nature. It does not constitute a recommendation to buy or sell any stock, and does not take account of your objectives, or your financial situation. Simply Wall St has no position in the stocks mentioned.
We aim to bring you long-term focused research analysis driven by fundamental data. Note that our analysis may not factor in the latest price-sensitive company announcements or qualitative material. Thank you for reading.
