AllianceBernstein Holding LP's Dividend Analysis
Insights into the Dividend Performance and Sustainability of AllianceBernstein Holding LP
AllianceBernstein Holding LP (NYSE:AB) recently announced a dividend of $0.65 per share, payable on 2023-11-22, with the ex-dividend date set for 2023-11-03. As investors look forward to this upcoming payment, the spotlight also shines on the company's dividend history, yield, and growth rates. Using the data from GuruFocus, let's delve into AllianceBernstein Holding LP's dividend performance and assess its sustainability.
Understanding AllianceBernstein Holding LP
This Powerful Chart Made Peter Lynch 29% A Year For 13 Years
How to calculate the intrinsic value of a stock?
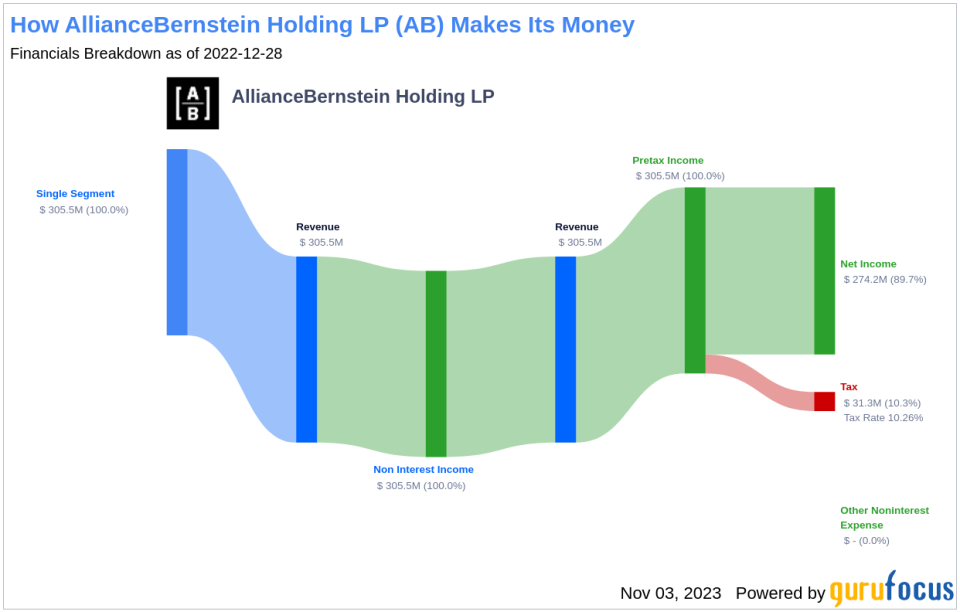
AllianceBernstein provides investment management services to institutional (44% of assets under management), retail (39%), and private (17%) clients through products that include mutual funds, hedge funds, and separately managed accounts. As of September 2023, AB managed assets worth $669 billion, composed primarily of fixed-income (39% of AUM) and equity (42%) strategies, with other investments accounting for the remainder. The company also provides sell-side research and brokerage services through its Sanford Bernstein subsidiary.
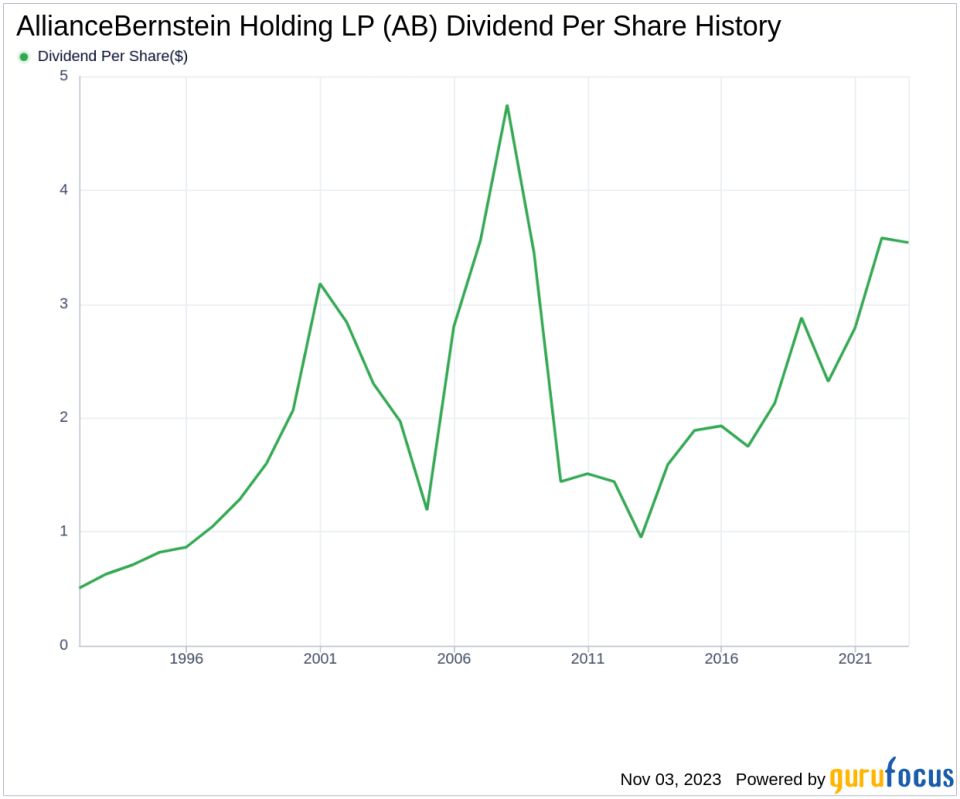
AllianceBernstein Holding LP's Dividend History
AllianceBernstein Holding LP has maintained a consistent dividend payment record since 1988, with dividends currently distributed on a quarterly basis.
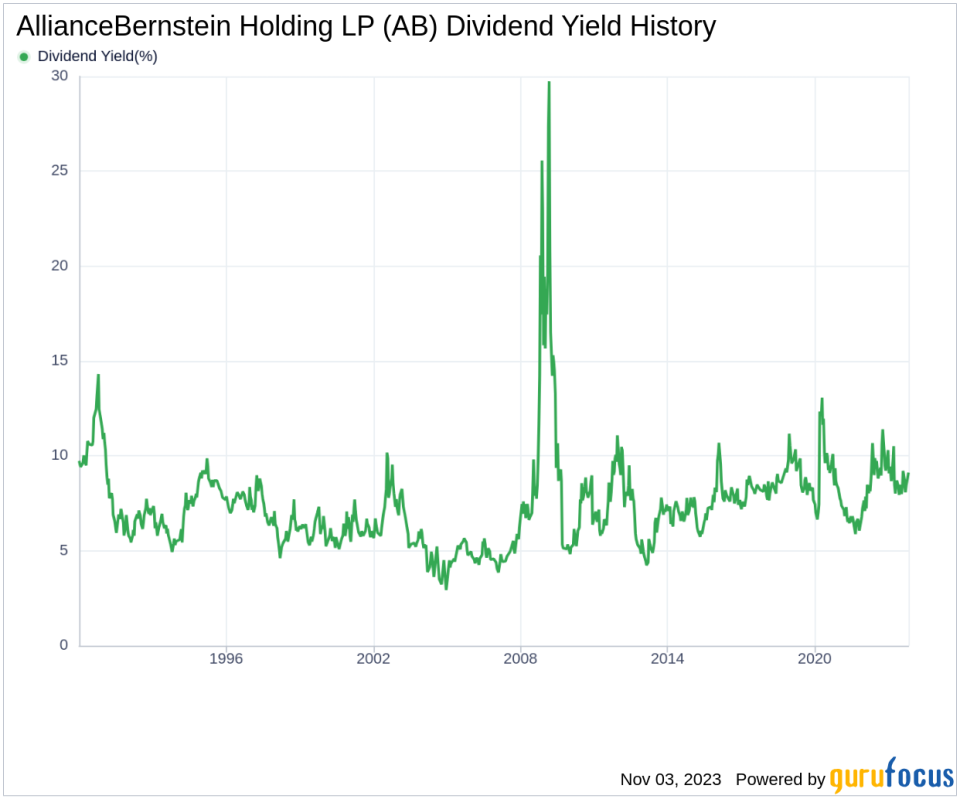
Dividend Yield and Growth of AllianceBernstein Holding LP
AllianceBernstein Holding LP currently has a 12-month trailing dividend yield of 8.99% and a 12-month forward dividend yield of 9.04%. This suggests an expectation of increased dividend payments over the next 12 months.
Over the past three years, AllianceBernstein Holding LP's annual dividend growth rate was 15.10%. This rate decreased to 10.10% per year over a five-year horizon. Over the past decade, AllianceBernstein Holding LP's annual dividends per share growth rate stands at an impressive 11.40%.
Based on AllianceBernstein Holding LP's dividend yield and five-year growth rate, the 5-year yield on cost of AllianceBernstein Holding LP stock as of today is approximately 14.54%.
Assessing Dividend Sustainability: Payout Ratio and Profitability
The dividend payout ratio of AllianceBernstein Holding LP, which stands at 1.18 as of 2023-09-30, provides insight into the portion of earnings the company distributes as dividends. A lower ratio suggests that the company retains a significant part of its earnings, ensuring the availability of funds for future growth and unexpected downturns.
AllianceBernstein Holding LP's profitability rank of 5 out of 10 suggests fair profitability. The company has reported positive net income each year over the past decade, further solidifying its high profitability.
Examining Growth Metrics
AllianceBernstein Holding LP's growth rank of 5 out of 10 suggests a fair growth outlook. The company's revenue per share and 3-year revenue growth rate indicate a strong revenue model, with revenue increasing by approximately 2.60% per year on average.
Over the past three years, AllianceBernstein Holding LP's earnings increased by approximately 5.10% per year on average, as indicated by the company's 3-year EPS growth rate. The company's 5-year EBITDA growth rate stands at 8.70%.
Concluding Thoughts
AllianceBernstein Holding LP's consistent dividend payments, impressive growth rate, and fair profitability make it a potential candidate for income-focused investors. However, its high payout ratio and moderate growth metrics warrant close monitoring for sustainability in the long run. As always, investors are advised to conduct thorough research before making investment decisions.
GuruFocus Premium users can screen for high-dividend yield stocks using the High Dividend Yield Screener.
This article, generated by GuruFocus, is designed to provide general insights and is not tailored financial advice. Our commentary is rooted in historical data and analyst projections, utilizing an impartial methodology, and is not intended to serve as specific investment guidance. It does not formulate a recommendation to purchase or divest any stock and does not consider individual investment objectives or financial circumstances. Our objective is to deliver long-term, fundamental data-driven analysis. Be aware that our analysis might not incorporate the most recent, price-sensitive company announcements or qualitative information. GuruFocus holds no position in the stocks mentioned herein.
This article first appeared on GuruFocus.
