Altcoin Season Rages as Bitcoin Dominance (BTCD) Slides
The bitcoin dominance rate (BTCD) has fallen below two long-term support levels. BTCD has been on a sharp downward slope since the beginning of the year.
The BTCD is expected to continue decreasing in the long term. The relationship to BTC is negative, meaning that a price increase in the latter is causing a BTCD drop.
Long-term BTCD breakdown
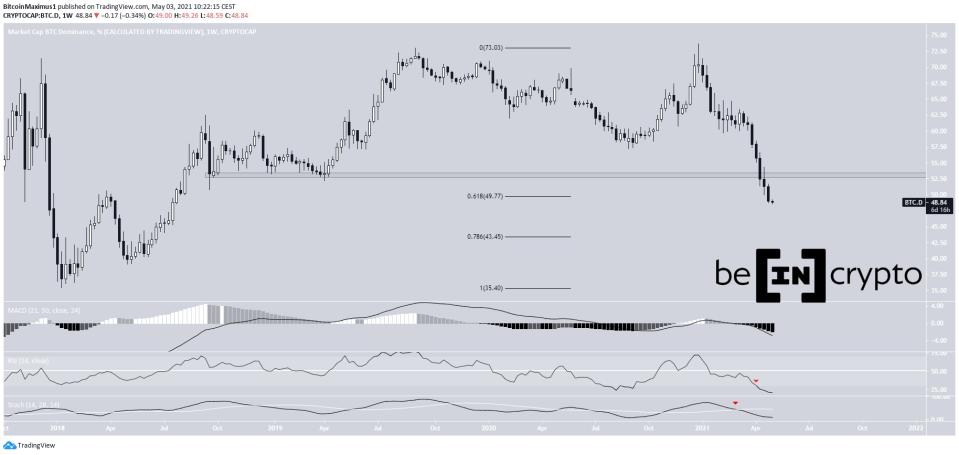
Cryptocurrency trader @TradingTank outlined a bitcoin dominance chart, predicting a continued downward movement that is likely to take the BTCD all the way down to 36%.

The readings from the weekly time frame support this assessment. The MACD is negative and decreasing. Likewise, the RSI is decreasing and is currently below 30. Finally, the Stochastic oscillator has made a bearish cross and is also moving downwards.
An interesting development is that the BTCD has already fallen down below the 53% long-term support level. Previously, the support level had held since October 2019. Furthermore, it has now fallen below the 0.618 Fib retracement support level at 49.7%.
The next support levels are found at 43.5% (0.786 Fib retracement) and 35.5% (2018 lows).
Weak attempt at a reversal
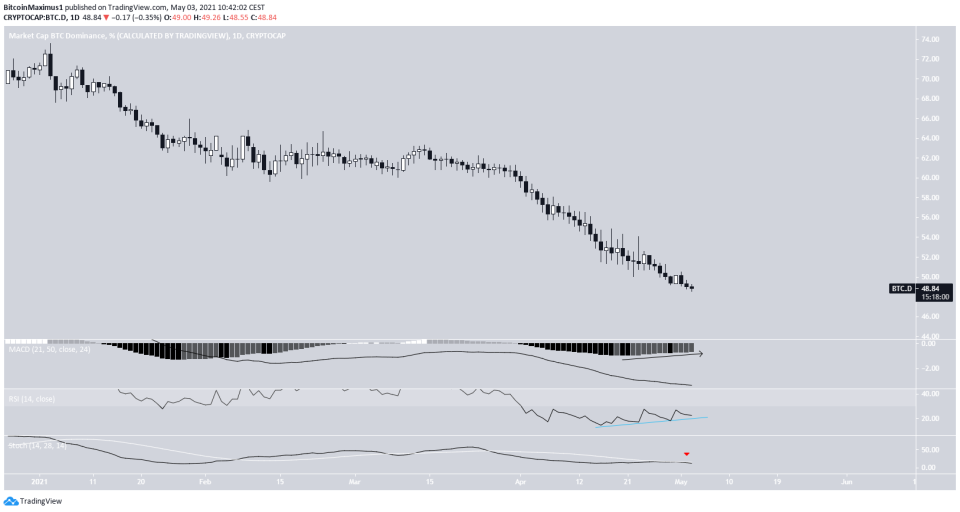
The daily chart provides some mixed signals. Firstly, the BTCD trajectory is bearish since it has yet to attempt to make a higher low.
In addition, technical indicators are bearish.
While the MACD is increasing, it has failed to give a bullish reversal signal. The RSI has generated a bullish divergence but is still inside the oversold territory. Finally, the Stochastic oscillator has rejected a bearish cross.
These indicators, however, are not sufficient to invalidate the bearish readings from the weekly time frame.
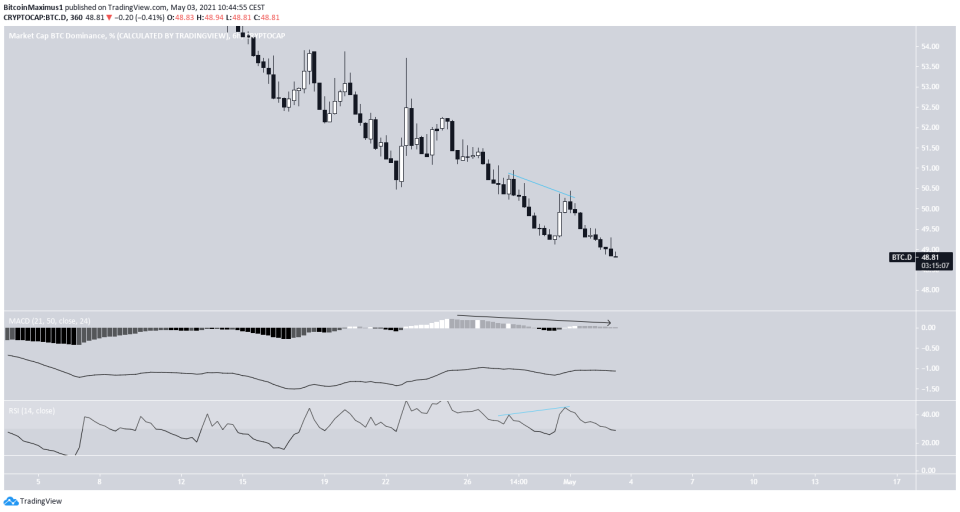
The six-hour BTCD chart is similarly bearish. Alongside the ongoing decrease, technical indicators are bearish.
The MACD is decreasing and the RSI is likewise falling after generating a hidden bearish divergence.
Relationship to BTC
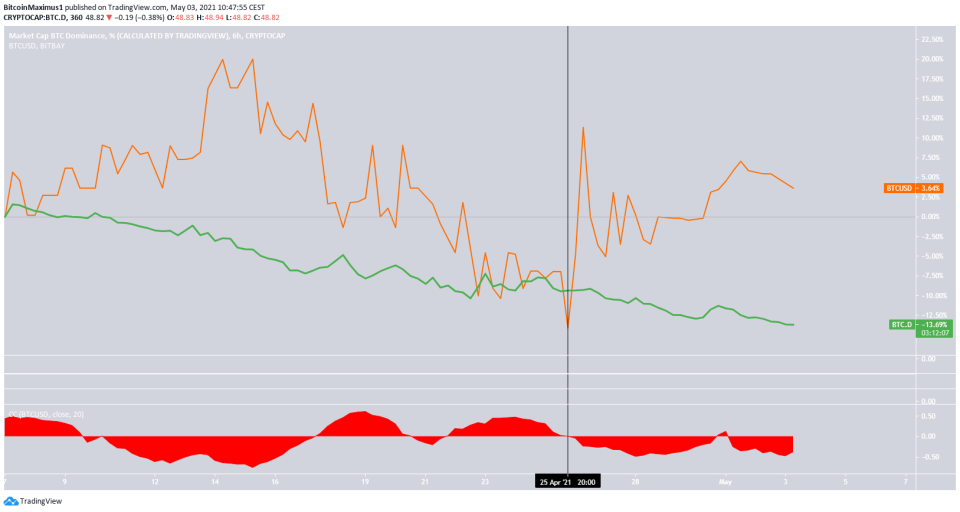
Since the April 25 bounce (black line), the relationship to BTC (orange) has been negative. This means that an increase in the price of BTC has caused a decrease in BTCD (green).
This is also visible by the correlation coefficient, which currently has a value of -0.5. A value of -1 would indicate a perfectly negative correlation.
Conclusion
The bitcoin dominance rate is expected to resume its descent towards the support levels at 43.5% and potentially could fall to 35.4%.
For BeInCrypto’s latest bitcoin (BTC) analysis, click here.
