Altria Group Inc (NYSE:MO): Did It Outperform The Industry?

When Altria Group Inc (NYSE:MO) announced its most recent earnings (30 June 2018), I compared it against two factor: its historical earnings track record, and the performance of its industry peers on average. Being able to interpret how well Altria Group has done so far requires weighing its performance against a benchmark, rather than looking at a standalone number at a point in time. In this article, I’ve summarized the key takeaways on how I see MO has performed.
Check out our latest analysis for Altria Group
Was MO’s recent earnings decline indicative of a tough track record?
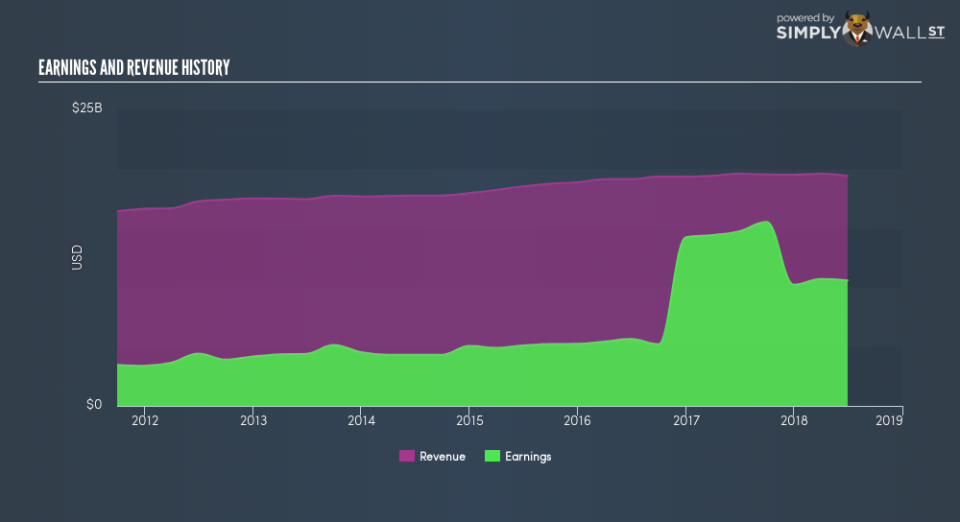
MO’s trailing twelve-month earnings (from 30 June 2018) of US$10.59b has declined by -28.14% compared to the previous year. Furthermore, this one-year growth rate has been lower than its average earnings growth rate over the past 5 years of 21.78%, indicating the rate at which MO is growing has slowed down. Why could this be happening? Let’s examine what’s occurring with margins and whether the whole industry is feeling the heat.
In the past couple of years, revenue growth has not been able to catch up, which suggests that Altria Group’s bottom line has been propelled by unmaintainable cost-reductions. Scanning growth from a sector-level, the US tobacco industry has been growing, albeit, at a unexciting single-digit rate of 6.69% over the prior year, and 6.03% over the past five. This growth is a median of profitable companies of 15 Tobacco companies in US including Standard Diversified, Standard Diversified and British American Tobacco (Malaysia) Berhad. This means whatever uplift the industry is profiting from, Altria Group has not been able to leverage it as much as its industry peers.
In terms of returns from investment, Altria Group has invested its equity funds well leading to a 66.99% return on equity (ROE), above the sensible minimum of 20%. Furthermore, its return on assets (ROA) of 26.13% exceeds the US Tobacco industry of 9.98%, indicating Altria Group has used its assets more efficiently. However, its return on capital (ROC), which also accounts for Altria Group’s debt level, has declined over the past 3 years from 32.84% to 27.55%.
What does this mean?
Though Altria Group’s past data is helpful, it is only one aspect of my investment thesis. Companies that are profitable, but have unpredictable earnings, can have many factors influencing its business. I suggest you continue to research Altria Group to get a more holistic view of the stock by looking at:
Future Outlook: What are well-informed industry analysts predicting for MO’s future growth? Take a look at our free research report of analyst consensus for MO’s outlook.
Financial Health: Are MO’s operations financially sustainable? Balance sheets can be hard to analyze, which is why we’ve done it for you. Check out our financial health checks here.
Other High-Performing Stocks: Are there other stocks that provide better prospects with proven track records? Explore our free list of these great stocks here.
NB: Figures in this article are calculated using data from the trailing twelve months from 30 June 2018. This may not be consistent with full year annual report figures.
To help readers see past the short term volatility of the financial market, we aim to bring you a long-term focused research analysis purely driven by fundamental data. Note that our analysis does not factor in the latest price-sensitive company announcements.
The author is an independent contributor and at the time of publication had no position in the stocks mentioned. For errors that warrant correction please contact the editor at editorial-team@simplywallst.com.
