America’s Car-Mart Reports Second Quarter 2024 Results

Key Operating Metrics

ROGERS, Ark., Dec. 05, 2023 (GLOBE NEWSWIRE) -- America’s Car-Mart, Inc. (NASDAQ: CRMT) (“we,” “Car-Mart” or the “Company”), one of the largest publicly held automotive retailers in the United States, today reported financial results for the second quarter ended October 31, 2023.
Second Quarter Key Highlights (Q2 FY24 vs. Q2 FY23)
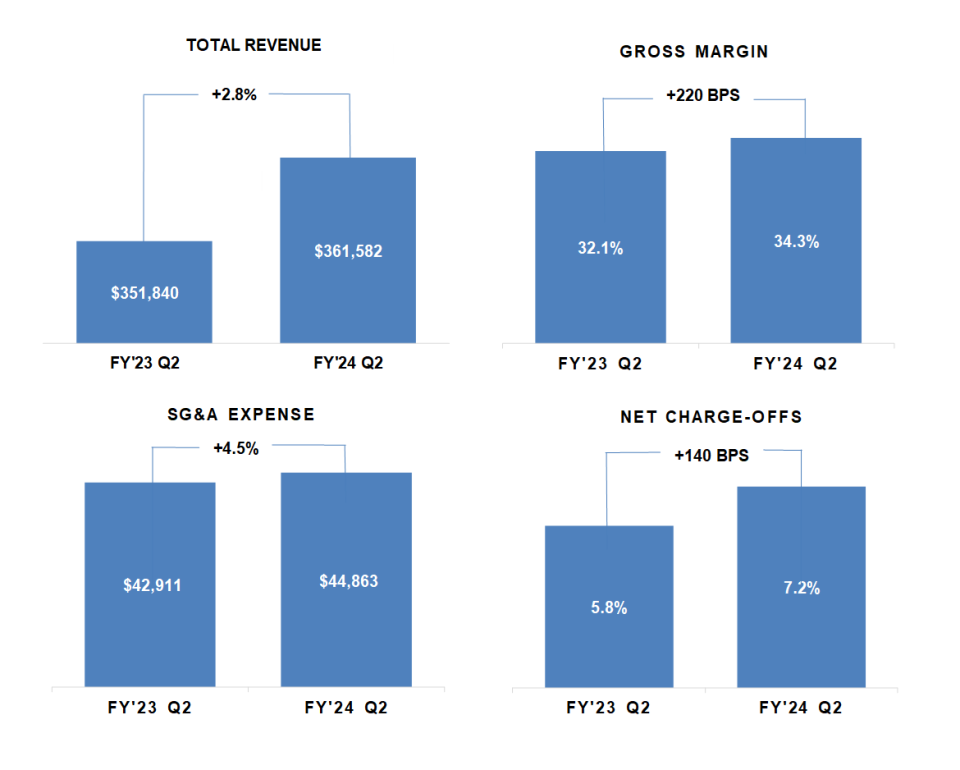
Revenues increased 2.8% to $361.6 million
Retail unit sales were down 4.6%
Gross margin increased to 34.3% from 32.1%
Customer count increased 6.0% to 104,596
Net charge-offs as a % of average finance receivables were 7.2% vs. 5.8%
Allowance for credit loss adjusted to 26.04% (EPS reduction of $3.40 after tax)
Loss per share $4.30 vs. $0.48 diluted earnings per share
Expanding dealership footprint with a strategic one-location acquisition expected to close in Q3; enhancing market presence and customer service capabilities
“Our second quarter results reflect the Car-Mart team’s commitment and focus on delivering value to our customers during a challenging economy. Revenue was up 2.8%, primarily due to interest income despite unit sales being down 4.6% during the quarter. The persistent inflationary environment impacted existing customers, which was evident in our credit losses. This required an increase in the allowance for credit losses which subsequently impacted the bottom line for the quarter. We believe these headwinds regarding credit loss are shorter-term in nature. The operational investments we’ve made are driving greater efficiencies in the business, one of which was gross margin, which was a bright spot during the quarter. However, we are equally focused on being more agile regarding our cost structure to effectively navigate this environment. We believe this will leave our consumer and our Company well-positioned for success in the long term.”
Doug Campbell
President and CEO, America’s Cart-Mart
Key Operating Metrics
Dollars in thousands, except per share data. Dollar and percentage changes may not recalculate due to rounding. Charts may not be to scale.
An infographic accompanying this announcement is available at https://www.globenewswire.com/NewsRoom/AttachmentNg/bb686d9e-b17b-4930-97f9-4fa594c821cc
TOTAL REVENUE – The 2.8% increase in revenue resulted from a 23% increase in interest income and a 5.6% increase in average retail sales price. Approximately 40% of this increase was related to the vehicle selling price. This was partially offset by a 4.6% decrease in units sold.
SALES – Sales for the quarter were 15,162 units vs. 15,885 units, down 4.6% vs. the prior year quarter. August and September sales were strong collectively posting a year-over-year (YOY) gain on unit sales, but October displayed mixed results. Overall website traffic was up YOY when looking at the number of unique visitors to our website. Online credit applications (OCAs) were also up YOY by 19%; however, conversions to sales declined in October. Although affordability of used vehicles in the current market continues to present some challenges, we continue to make good progress in terms of lowering purchase price, vehicle mileage, and providing newer model year vehicles for our customers to choose from. This is and will continue to contribute to improved affordability. Additionally, we believe certain underwriting changes contributed to some of the sales decline in October as we balance onboarding new stores, sales volumes, and new underwriting guidelines through our loan origination system (LOS).
GROSS PROFIT – Gross profit per unit was $6,835 compared to $6,132 for the prior year’s second quarter. The improvement in gross profit over the prior year's quarter resulted from our continued focus on inventory efficiencies in procurement, remarketing, and repairs. We have identified strategic partnerships to assist us in providing more lower-cost units, which should drive further improvements to gross profits.
NET CHARGE-OFFS – Net charge-offs (NCOs) as a percentage of average finance receivables were 7.2% compared to 5.8% during the prior year's second quarter, signaling a return to pre-pandemic net charge-off percentages. As a comparison, NCOs for the five-year period preceding the pandemic averaged 7.0% during the second quarters. Both the frequency and severity of losses played a factor in the increase, with frequency driving approximately two-thirds of the increase primarily due to the external environment. Severity was driven by longer contract terms and lower recovery values. We have experienced increases in both frequency and severity on some 2021/2022 pools as well. Sequentially, our accounts 30+ days past due improved by 80 basis points as they dropped from 4.4% to 3.6%. This is important as delinquencies are a leading indicator to overall credit loss, and we are seeing evidence of improved losses in November.
ALLOWANCE FOR CREDIT LOSSES – The Company increased the allowance for credit loss from 23.91% to 26.04% sequentially, resulting in a $28 million charge to the provision (basic earnings per share loss of $3.40 after tax). This non-cash adjustment reflects a one-time increase primarily driven by the recent increases in net charge-offs, underscoring the challenges and economic pressure on our subprime consumer. As vehicle prices normalize and potentially decrease over time, credit losses are expected to decline. Our quarterly cash-on-cash returns are strong and in line with historical returns. Management is addressing the credit loss increases through proactive risk management from both the vehicle aspect and the customer aspect as well as enhancing underwriting guidelines to improve the profile of the portfolio.
UNDERWRITING – Approximately 45% of sales at quarter-end are now being originated through our new LOS. Despite the higher than expected NCOs experienced during the quarter our returns are still attractive. However, we look for continuous improvement and adaptability in our underwriting and our LOS will allow us to be more nimble with that. Therefore, our team worked hard on implementing some of the new underwriting changes earlier than planned. Those included driving higher down payments and lower terms for originations on the LOS. The initial results were very positive, with down payments on LOS averaging 5.5% vs. 4.6% for deals originated within our legacy system. Similar improvements were seen related to originating terms lengths as those fell to approximately 42.0 months on LOS compared to approximately 44.0 months for deals originated in the legacy system. This drove average originating term downward to 44.1 months for the quarter, down from 44.7 months sequentially. This represented the largest reduction in term since July 2019.
SG&A EXPENSE – SG&A expense was $44.9 million compared to $42.9 million during last year’s second quarter; approximately 64% of our SG&A is people-related to serve a growing base of customers, now at 104,596 customers which is 6% higher than the prior year’s quarter. SG&A per average account was $429 compared to $439 during the prior year’s second quarter. During the quarter we began to take deliberate steps to reduce costs prospectively. Approximately 75% of our SG&A spend is at the field and dealership level. Since the quarter end, we have reduced the size of our corporate workforce by 10% through a series of strategic decisions, limited hiring, reduced marketing spend and curtailed the use of some professional services. We will continue to evaluate spending at both the dealership and corporate level. We believe these reductions will assist in mitigating the increased costs of doing business in this inflationary environment.
ACQUISITIONS & DISPOSITIONS – We have entered into an agreement to purchase Central Auto Sales in Hot Springs, Arkansas (“Central Auto”). Central Auto is a 25-year-old company owned by Mike and Stacey Steven-Assheuer. We are very excited about their business, the strong culture they have created, and the opportunity to step into this successful operation. The structure will be consistent with prior transactions whereby we will not acquire credit risk, and the sellers may receive a performance based earn-out.
We also have several stores which we are performance managing by restricting capital. We expect that restricting investments to these under-performing locations will rebalance our portfolio, allowing us to prioritize higher-ROI locations and redeploy cash more effectively. As mentioned before, we will be more agile in deploying strategies that provide the best return for our shareholders. Lastly, we closed an additional location during the quarter.
TERM SECURITIZATION – Our April 2022 series of asset-back non-recourse notes are now eligible for optional redemption at the Company’s discretion, as the remaining principal balance is 10% or less of the original principal balance and the purchase price conditions have been met.
Key Operating Results
|
| Three Months Ended |
|
| ||||||||
|
| October 31, |
|
| ||||||||
|
|
| 2023 |
|
|
| 2022 |
|
| % Change | ||
Operating Data: |
|
|
|
|
|
|
| |||||
Retail units sold |
|
| 15,162 |
|
|
| 15,885 |
|
| (4.6 | ) | % |
Average number of stores in operation |
|
| 154 |
|
|
| 154 |
|
| - |
|
|
Average retail units sold per store per month |
|
| 32.8 |
|
|
| 34.4 |
|
| (4.7 | ) |
|
Average retail sales price |
| $ | 19,035 |
|
| $ | 18,025 |
|
| 5.6 |
|
|
Total gross profit per retail unit sold |
| $ | 6,835 |
|
| $ | 6,132 |
|
| 11.5 |
|
|
Total gross profit percentage |
|
| 34.3 | % |
|
| 32.1 | % |
|
|
| |
Same store revenue growth |
|
| 2.7 | % |
|
| 22.2 | % |
|
|
| |
Net charge-offs as a percent of average finance receivables |
|
| 7.2 | % |
|
| 5.8 | % |
|
|
| |
Total collected (principal, interest and late fees) |
| $ | 168,282 |
|
| $ | 150,765 |
|
| 11.6 |
|
|
Average total collected per active customer per month |
| $ | 533 |
|
| $ | 514 |
|
| 3.7 |
|
|
Average percentage of finance receivables-current (excl. 1-2 day) |
|
| 80.4 | % |
|
| 80.8 | % |
|
|
| |
Average down-payment percentage |
|
| 4.9 | % |
|
| 5.1 | % |
|
|
| |
|
|
|
|
|
|
|
| |||||
|
|
|
|
|
|
|
| |||||
|
|
|
|
|
|
|
| |||||
|
| Six Months Ended |
|
| ||||||||
|
| October 31, |
|
| ||||||||
|
|
| 2023 |
|
|
| 2022 |
|
| % Change | ||
Operating Data: |
|
|
|
|
|
|
| |||||
Retail units sold |
|
| 31,074 |
|
|
| 31,421 |
|
| (1.1 | ) | % |
Average number of stores in operation |
|
| 155 |
|
|
| 154 |
|
| 0.6 |
|
|
Average retail units sold per store per month |
|
| 33.4 |
|
|
| 34.0 |
|
| (1.8 | ) |
|
Average retail sales price |
| $ | 18,914 |
|
| $ | 18,045 |
|
| 4.8 |
|
|
Total gross profit per retail unit sold |
| $ | 6,801 |
|
| $ | 6,326 |
|
| 7.5 |
|
|
Total gross profit percentage |
|
| 34.4 | % |
|
| 33.2 | % |
|
|
| |
Same store revenue growth |
|
| 5.4 | % |
|
| 21.4 | % |
|
|
| |
Net charge-offs as a percent of average finance receivables |
|
| 13.1 | % |
|
| 11.0 | % |
|
|
| |
Total collected (principal, interest and late fees) |
| $ | 334,029 |
|
| $ | 298,986 |
|
| 11.7 |
|
|
Average total collected per active customer per month |
| $ | 534 |
|
| $ | 515 |
|
| 3.7 |
|
|
Average percentage of finance receivables-current (excl. 1-2 day) |
|
| 80.4 | % |
|
| 80.6 | % |
|
|
| |
Average down-payment percentage |
|
| 4.9 | % |
|
| 5.2 | % |
|
|
| |
|
|
|
|
|
|
|
| |||||
|
|
|
|
|
|
|
| |||||
Period End Data: |
|
|
|
|
|
|
| |||||
Stores open |
|
| 153 |
|
|
| 154 |
|
| (0.6 | ) | % |
Accounts over 30 days past due |
|
| 3.6 | % |
|
| 3.6 | % |
|
|
| |
Active customer count |
|
| 104,596 |
|
|
| 98,636 |
|
| 6.0 |
|
|
Principal balance of finance receivable |
| $ | 1,463,398 |
|
| $ | 1,259,649 |
|
| 16.2 |
|
|
Weighted average total contract term |
|
| 47.3 |
|
|
| 44.8 |
|
| 5.6 |
|
|
|
|
|
|
|
|
|
| |||||
Conference Call and Webcast
The Company will hold a conference call to discuss its quarterly results on Tuesday, December 5, 2023, at 11 am ET. Participants may access the conference call via webcast using this link: Webcast Link Here. To participate via telephone, please register in advance using this Registration Link. Upon registration, all telephone participants will receive a one-time confirmation email detailing how to join the conference call, including the dial-in number along with a unique PIN that can be used to access the call. All participants are encouraged to dial 10 minutes prior to the start time. A replay and transcript of the conference call and webcast will be available on-demand, which will be available for 12 months.
About America’s Car-Mart, Inc.
America’s Car-Mart, Inc. (the “Company”) operates automotive dealerships in 12 states and is one of the largest publicly held automotive retailers in the United States focused exclusively on the “Integrated Auto Sales and Finance” segment of the used car market. The Company emphasizes superior customer service and the building of strong personal relationships with its customers. The Company operates its dealerships primarily in smaller cities throughout the South-Central United States, selling quality used vehicles and providing financing for substantially all of its customers. For more information about America’s Car-Mart, including investor presentations, please visit our website at www.car-mart.com.
Forward-Looking Statements
This news release contains “forward-looking statements” within the meaning of the Private Securities Litigation Reform Act of 1995. These forward-looking statements address the Company’s future objectives, plans and goals, as well as the Company’s intent, beliefs and current expectations regarding future operating performance and can generally be identified by words such as “may,” “will,” “should,” “could,” “expect,” “anticipate,” “intend,” “plan,” “foresee,” and other similar words or phrases. Specific events addressed by these forward-looking statements may include, but are not limited to:
operational infrastructure investments;
same dealership sales and revenue growth;
customer growth;
gross profit percentages;
gross profit per retail unit sold;
business acquisitions;
technological investments and initiatives;
future revenue growth;
receivables growth as related to revenue growth;
new dealership openings;
performance of new dealerships;
interest rates;
future credit losses;
the Company’s collection results, including but not limited to collections during income tax refund periods;
seasonality; and
the Company’s business, operating and growth strategies and expectations.
These forward-looking statements are based on the Company’s current estimates and assumptions and involve various risks and uncertainties. As a result, you are cautioned that these forward-looking statements are not guarantees of future performance, and that actual results could differ materially from those projected in these forward-looking statements. Factors that may cause actual results to differ materially from the Company’s projections include, but are not limited to:
general economic conditions in the markets in which the Company operates, including but not limited to fluctuations in gas prices, grocery prices and employment levels and inflationary pressure on operating costs;
the availability of quality used vehicles at prices that will be affordable to our customers, including the impacts of changes in new vehicle production and sales;
the availability of credit facilities and access to capital through securitization financings or other sources on terms acceptable to us to support the Company’s business;
the Company’s ability to underwrite and collect its contracts effectively;
competition;
dependence on existing management;
ability to attract, develop, and retain qualified general managers;
changes in consumer finance laws or regulations, including but not limited to rules and regulations that have recently been enacted or could be enacted by federal and state governments;
the ability to keep pace with technological advances and changes in consumer behavior affecting our business;
security breaches, cyber-attacks, or fraudulent activity;
the ability to identify and obtain favorable locations for new or relocated dealerships at reasonable cost;
the ability to successfully identify, complete and integrate new acquisitions; and
potential business and economic disruptions and uncertainty that may result from any future public health crises and any efforts to mitigate the financial impact and health risks associated with such developments.
Additionally, risks and uncertainties that may affect future results include those described from time to time in the Company’s SEC filings. The Company undertakes no obligation to update or revise any forward-looking statements, whether as a result of new information, future events or otherwise. You are cautioned not to place undue reliance on these forward-looking statements, which speak only as of the dates on which they are made.
Contacts
Vickie Judy, CFO
479-464-9944
Investor_relations@car-mart.com
America’s Car-Mart | ||||||||||||||||||||||
| ||||||||||||||||||||||
(Amounts in thousands, except per share data) | ||||||||||||||||||||||
|
|
|
|
|
|
|
|
|
|
|
| As a % of Sales | ||||||||||
|
|
|
|
| Three Months Ended |
|
|
| Three Months Ended | |||||||||||||
|
|
|
|
| October 31, |
|
|
| October 31, | |||||||||||||
|
|
|
|
| 2023 |
| 2022 |
| % Change |
| 2023 |
| 2022 | |||||||||
Statements of Operations: |
|
|
|
|
|
|
|
|
|
|
|
|
| |||||||||
Revenues: |
|
|
|
|
|
|
|
|
|
|
|
|
| |||||||||
| Sales |
| $ | 302,200 |
|
| $ | 303,554 |
|
| (0.4 | ) | % |
| 100.0 |
| % |
| 100.0 | % | ||
| Interest income |
|
| 59,382 |
|
|
| 48,286 |
|
| 23.0 |
|
|
| 19.6 |
|
|
| 15.9 |
| ||
|
|
| Total |
|
| 361,582 |
|
|
| 351,840 |
|
| 2.8 |
|
|
| 119.6 |
|
|
| 115.9 |
|
|
|
|
|
|
|
|
|
|
|
|
|
|
|
|
|
| ||||||
Costs and expenses: |
|
|
|
|
|
|
|
|
|
|
|
|
| |||||||||
| Cost of sales |
|
| 198,563 |
|
|
| 206,142 |
|
| (3.7 | ) |
|
| 65.7 |
|
|
| 67.9 |
| ||
| Selling, general and administrative |
|
| 44,863 |
|
|
| 42,911 |
|
| 4.5 |
|
|
| 14.8 |
|
|
| 14.1 |
| ||
| Provision for credit losses |
|
| 135,395 |
|
|
| 88,828 |
|
| 52.4 |
|
|
| 44.8 |
|
|
| 29.3 |
| ||
| Interest expense |
|
| 16,582 |
|
|
| 8,350 |
|
| 98.6 |
|
|
| 5.5 |
|
|
| 2.8 |
| ||
| Depreciation and amortization |
|
| 1,696 |
|
|
| 1,309 |
|
| 29.6 |
|
|
| 0.6 |
|
|
| 0.4 |
| ||
| Loss on disposal of property and equipment |
|
| 74 |
|
|
| 242 |
|
| - |
|
|
| 0.0 |
|
|
| - |
| ||
|
|
| Total |
|
| 397,173 |
|
|
| 347,782 |
|
| 14.2 |
|
|
| 131.4 |
|
|
| 114.6 |
|
|
|
|
|
|
|
|
|
|
|
|
|
|
|
|
|
| ||||||
|
|
| Income (Loss) before taxes |
|
| (35,591 | ) |
|
| 4,058 |
|
|
|
|
| (11.8 | ) |
|
| 1.3 |
| |
|
|
|
|
|
|
|
|
|
|
|
|
|
|
|
|
| ||||||
Provision for income taxes |
|
| (8,128 | ) |
|
| 919 |
|
|
|
|
| (2.7 | ) |
|
| 0.3 |
| ||||
|
|
|
|
|
|
|
|
|
|
|
|
|
|
|
|
| ||||||
|
|
| Net income (loss) |
| $ | (27,463 | ) |
| $ | 3,139 |
|
|
|
|
| (9.1 | ) |
|
| 1.0 |
| |
|
|
|
|
|
|
|
|
|
|
|
|
|
|
|
|
| ||||||
Dividends on subsidiary preferred stock |
| $ | (10 | ) |
| $ | (10 | ) |
|
|
|
|
|
|
|
|
| |||||
|
|
|
|
|
|
|
|
|
|
|
|
|
|
|
|
| ||||||
|
|
| Net income (loss) attributable to common shareholders |
| $ | (27,473 | ) |
| $ | 3,129 |
|
|
|
|
|
|
|
|
|
| ||
|
|
|
|
|
|
|
|
|
|
|
|
|
|
|
|
| ||||||
Earnings per share: |
|
|
|
|
|
|
|
|
|
|
|
|
| |||||||||
| Basic |
| $ | (4.30 | ) |
| $ | 0.49 |
|
|
|
|
|
|
|
|
|
| ||||
| Diluted |
| $ | (4.30 | ) |
| $ | 0.48 |
|
|
|
|
|
|
|
|
|
| ||||
|
|
|
|
|
|
|
|
|
|
|
|
|
|
|
|
| ||||||
Weighted average number of shares used in calculation: |
|
|
|
|
|
|
|
|
|
|
|
| ||||||||||
| Basic |
|
| 6,386,208 |
|
|
| 6,368,840 |
|
|
|
|
|
|
|
|
|
| ||||
| Diluted |
|
| 6,386,208 |
|
|
| 6,548,271 |
|
|
|
|
|
|
|
|
|
| ||||
|
|
|
|
|
|
|
|
|
|
|
|
|
|
|
|
|
|
| ||||
America’s Car-Mart | ||||||||||||||||||||||
| ||||||||||||||||||||||
(Amounts in thousands, except per share data) | ||||||||||||||||||||||
|
|
|
|
|
|
|
|
|
| As a % of Sales | ||||||||||||
|
|
|
|
| Six Months Ended |
|
|
| Three Months Ended | |||||||||||||
|
|
|
|
| October 31, |
|
|
| October 31, | |||||||||||||
|
|
|
|
| 2023 |
| 2022 |
| % Change |
| 2023 |
| 2022 | |||||||||
Statements of Operations: |
|
|
|
|
|
|
|
|
|
|
|
|
| |||||||||
Revenues: |
|
|
|
|
|
|
|
|
|
|
|
|
| |||||||||
| Sales |
| $ | 613,769 |
|
| $ | 598,031 |
|
| 2.6 |
| % |
| 100.0 |
| % |
| 100.0 | % | ||
| Interest income |
|
| 115,838 |
|
|
| 92,627 |
|
| 25.1 |
|
|
| 18.9 |
|
|
| 15.5 |
| ||
|
|
| Total |
|
| 729,607 |
|
|
| 690,658 |
|
| 5.6 |
|
|
| 118.9 |
|
|
| 115.5 |
|
|
|
|
|
|
|
|
|
|
|
|
|
|
|
|
|
| ||||||
Costs and expenses: |
|
|
|
|
|
|
|
|
|
|
|
|
| |||||||||
| Cost of sales |
|
| 402,442 |
|
|
| 399,257 |
|
| 0.8 |
|
|
| 65.6 |
|
|
| 66.8 |
| ||
| Selling, general and administrative |
|
| 91,333 |
|
|
| 86,145 |
|
| 6.0 |
|
|
| 14.9 |
|
|
| 14.4 |
| ||
| Provision for credit losses |
|
| 231,718 |
|
|
| 165,068 |
|
| 40.4 |
|
|
| 37.8 |
|
|
| 27.6 |
| ||
| Interest expense |
|
| 30,856 |
|
|
| 15,695 |
|
| 96.6 |
|
|
| 5.0 |
|
|
| 2.6 |
| ||
| Depreciation and amortization |
|
| 3,389 |
|
|
| 2,460 |
|
| 37.8 |
|
|
| 0.6 |
|
|
| 0.4 |
| ||
| Loss on disposal of property and equipment |
|
| 240 |
|
|
| 251 |
|
| (4.4 | ) |
|
| - |
|
|
| - |
| ||
|
|
| Total |
|
| 759,978 |
|
|
| 668,876 |
|
| 13.6 |
|
|
| 123.8 |
|
|
| 111.8 |
|
|
|
|
|
|
|
|
|
|
|
|
|
|
|
|
|
| ||||||
|
|
| Income (Loss) before taxes |
|
| (30,371 | ) |
|
| 21,782 |
|
|
|
|
| (4.9 | ) |
|
| 3.6 |
| |
|
|
|
|
|
|
|
|
|
|
|
|
|
|
|
|
| ||||||
Provision for income taxes |
|
| (7,094 | ) |
|
| 4,946 |
|
|
|
|
| (1.2 | ) |
|
| 0.8 |
| ||||
|
|
|
|
|
|
|
|
|
|
|
|
|
|
|
|
| ||||||
|
|
| Net income (loss) |
| $ | (23,277 | ) |
| $ | 16,836 |
|
|
|
|
| (3.8 | ) |
|
| 2.8 |
| |
|
|
|
|
|
|
|
|
|
|
|
|
|
|
|
|
| ||||||
Dividends on subsidiary preferred stock |
| $ | (20 | ) |
| $ | (20 | ) |
|
|
|
|
|
|
|
|
| |||||
|
|
|
|
|
|
|
|
|
|
|
|
|
|
|
|
| ||||||
|
|
| Net income (loss) attributable to common shareholders |
| $ | (23,297 | ) |
| $ | 16,816 |
|
|
|
|
|
|
|
|
|
| ||
|
|
|
|
|
|
|
|
|
|
|
|
|
|
|
|
| ||||||
Earnings per share: |
|
|
|
|
|
|
|
|
|
|
|
|
| |||||||||
| Basic |
| $ | (3.65 | ) |
| $ | 2.64 |
|
|
|
|
|
|
|
|
|
| ||||
| Diluted |
| $ | (3.65 | ) |
| $ | 2.56 |
|
|
|
|
|
|
|
|
|
| ||||
|
|
|
|
|
|
|
|
|
|
|
|
|
|
|
|
| ||||||
Weighted average number of shares used in calculation: |
|
|
|
|
|
|
|
|
|
|
|
| ||||||||||
| Basic |
|
| 6,383,956 |
|
|
| 6,371,083 |
|
|
|
|
|
|
|
|
|
| ||||
| Diluted |
|
| 6,383,956 |
|
|
| 6,574,928 |
|
|
|
|
|
|
|
|
|
| ||||
|
|
|
|
|
|
|
|
|
|
|
|
|
|
|
|
|
|
| ||||
America's Car-Mart, Inc. | ||||||||||||
Condensed Consolidated Balance Sheet and Other Data | ||||||||||||
(Unaudited) | ||||||||||||
| ||||||||||||
(Amounts in thousands, except per share data) | ||||||||||||
|
|
|
|
|
|
| ||||||
|
| October 31, |
| April 30, |
| October 31, | ||||||
|
| 2023 |
| 2023 |
| 2022 | ||||||
|
|
|
|
|
|
| ||||||
Cash and cash equivalents |
| $ | 4,313 |
|
| $ | 9,796 |
|
| $ | 4,529 |
|
Restricted cash from collections on auto finance receivables | $ | 90,180 |
|
| $ | 58,238 |
|
| $ | 32,565 |
| |
Finance receivables, net (1) |
| $ | 1,105,236 |
|
| $ | 1,063,460 |
|
| $ | 978,287 |
|
Inventory |
| $ | 113,846 |
|
| $ | 109,290 |
|
| $ | 130,298 |
|
Total assets (1) |
| $ | 1,487,149 |
|
| $ | 1,414,737 |
|
| $ | 1,301,609 |
|
Revolving lines of credit, net |
| $ | 165,509 |
|
| $ | 167,231 |
|
| $ | 302,123 |
|
Non-recourse notes payable, net |
| $ | 579,030 |
|
| $ | 471,367 |
|
| $ | 249,622 |
|
Treasury stock |
| $ | 297,489 |
|
| $ | 297,421 |
|
| $ | 297,421 |
|
Total equity |
| $ | 476,609 |
|
| $ | 498,547 |
|
| $ | 492,317 |
|
Shares outstanding |
|
| 6,392,838 |
|
|
| 6,373,404 |
|
|
| 6,368,840 |
|
Book value per outstanding share | $ | 74.62 |
|
| $ | 78.29 |
|
| $ | 77.36 |
| |
|
|
|
|
|
|
| ||||||
Allowance as % of principal balance net of deferred revenue |
| 26.04 | % |
|
| 23.91 | % |
|
| 23.65 | % | |
|
|
|
|
|
|
| ||||||
|
|
|
|
|
|
| ||||||
Changes in allowance for credit losses: |
|
|
|
|
| |||||||
|
| Six months ended |
|
| ||||||||
|
| October 31, |
|
| ||||||||
|
| 2023 |
| 2022 |
|
| ||||||
Balance at beginning of period |
| $ | 299,608 |
|
| $ | 237,823 |
|
|
| ||
Provision for credit losses |
|
| 231,718 |
|
|
| 165,068 |
|
|
| ||
Charge-offs, net of collateral recovered |
| (186,996 | ) |
|
| (130,161 | ) |
|
| |||
Balance at end of period |
| $ | 344,330 |
|
| $ | 272,730 |
|
|
| ||
|
|
|
|
|
|
| ||||||
(1) Some items in the prior year financial statements were reclassified to conform to the current presentation. Reclassification had no effect on the prior year net income or shareholder’s equity | ||||||||||||
| ||||||||||||
America's Car-Mart, Inc. | ||||||||||
Condensed Consolidated Statements of Cash Flows | ||||||||||
(Unaudited) | ||||||||||
| ||||||||||
(Amounts in thousands) | ||||||||||
|
|
|
| Six months ended | ||||||
|
|
|
| October 31, | ||||||
|
|
|
|
| 2023 |
|
|
| 2022 |
|
|
|
|
|
|
|
| ||||
Operating activities: |
|
|
|
| ||||||
| Net income (loss) |
| $ | (23,277 | ) |
| $ | 16,836 |
| |
| Provision for credit losses |
|
| 231,718 |
|
|
| 165,068 |
| |
| Losses on claims for accident protection plan |
| 15,173 |
|
|
| 11,232 |
| ||
| Depreciation and amortization |
| 3,389 |
|
|
| 2,460 |
| ||
| Finance receivable originations |
| (580,082 | ) |
|
| (580,838 | ) | ||
| Finance receivable collections |
| 218,208 |
|
|
| 206,358 |
| ||
| Inventory |
|
| 65,123 |
|
|
| 46,226 |
| |
| Deferred accident protection plan revenue |
| 1,306 |
|
|
| 13,328 |
| ||
| Deferred service contract revenue |
| 4,042 |
|
|
| 14,402 |
| ||
| Income taxes, net |
|
| (8,605 | ) |
|
| 850 |
| |
| Other(1) |
|
| (3,125 | ) |
|
| 8,947 |
| |
|
| Net cash used in operating activities |
| (76,130 | ) |
|
| (95,131 | ) | |
|
|
|
|
|
|
| ||||
Investing activities: |
|
|
|
| ||||||
| Purchase of investments |
|
| - |
|
|
| (225 | ) | |
| Purchase of property and equipment and other(1) |
| (1,588 | ) |
|
| (14,040 | ) | ||
|
| Net cash used in investing activities |
| (1,588 | ) |
|
| (14,265 | ) | |
|
|
|
|
|
|
| ||||
Financing activities: |
|
|
|
| ||||||
| Change in revolving credit facility, net |
| (2,152 | ) |
|
| 256,977 |
| ||
| Payments on non-recourse notes payable |
| (250,935 | ) |
|
| (149,184 | ) | ||
| Change in cash overdrafts |
|
| 1,416 |
|
|
| - |
| |
| Issuances of non-recourse notes payable |
| 360,340 |
|
|
| - |
| ||
| Debt issuance costs |
|
| (4,091 | ) |
|
| (39 | ) | |
| Purchase of common stock |
|
| (69 | ) |
|
| (5,195 | ) | |
| Dividend payments |
|
| (20 | ) |
|
| (20 | ) | |
| Exercise of stock options and issuance of common stock |
| (312 | ) |
|
| 1,364 |
| ||
|
| Net cash provided by financing activities |
| 104,177 |
|
|
| 103,903 |
| |
|
|
|
|
|
|
| ||||
Increase (decrease) in cash, cash equivalents, and restricted cash | $ | 26,459 |
|
| $ | (5,493 | ) | |||
|
|
|
|
|
|
| ||||
|
|
|
|
|
|
| ||||
(1) | Prepaid expenses and other assets at October 31, 2022, reflects an immaterial reclassification of approximately $8.4 million of capitalized implementation costs related to a cloud-computing arrangement previously recorded in property and equipment, net, and did not impact operating income. | |||||||||
|
|
|
|
|
|
| ||||

