America’s Car-Mart Reports Third Quarter Fiscal 2024 Results

Key Operating Metrics

ROGERS, Ark., March 08, 2024 (GLOBE NEWSWIRE) -- America’s Car-Mart, Inc. (NASDAQ: CRMT) (“we,” “Car-Mart” or the “Company”), today reported financial results for the third quarter ended January 31, 2024.
Third Quarter Key Highlights (Q3 FY24 vs. Q3 FY23, unless otherwise noted)
Completed implementation of updated loan origination system (LOS)
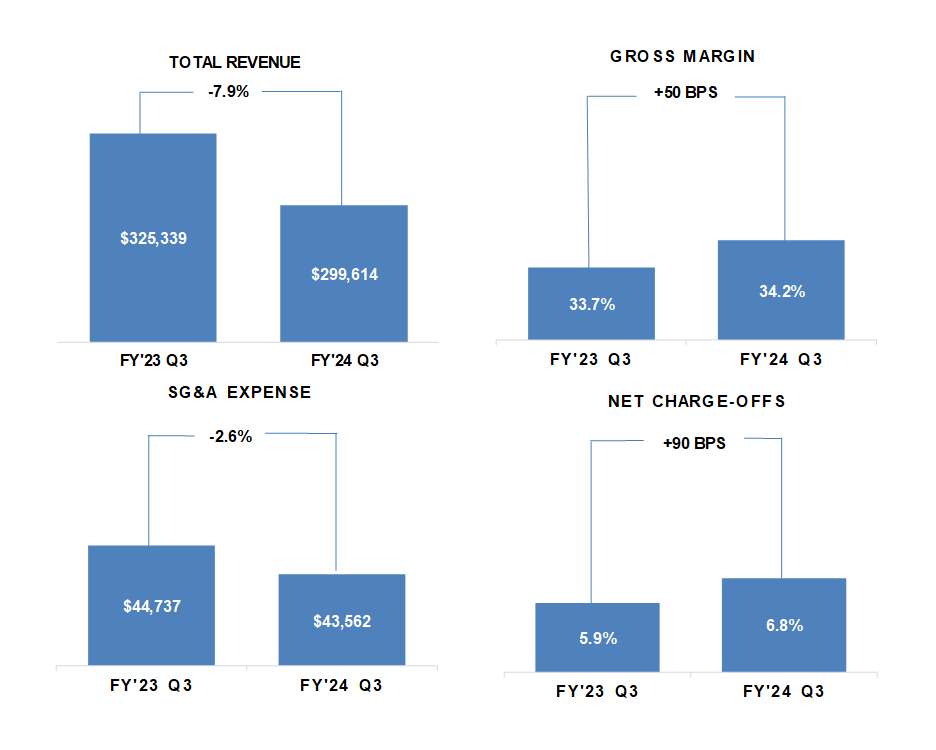
Q3 revenue was $299.6 million, down 7.9%
Total collections increased 9.3%
Allowance for credit loss adjusted to 25.74%, down sequentially 30 bps
Net charge-offs as a % of average finance receivables were 6.8% vs. 5.9%, down sequentially 40 bps
Loss per share $1.34 vs. $0.23 diluted earnings per share
Entered into a strategic partnership with Cox Automotive in February
“We continue to navigate a challenging macro environment facing our customers and remain focused on their success. While sales volumes fell short of our expectations during the quarter, they are not reflective of the efforts put forth by the team. I am encouraged by our continued progress during the quarter in gross profit, credit losses, and initial results generated by our loan origination system. We have implemented several initiatives to improve sales during the fourth quarter. Our priority is to be agile with our cost structure and investments to deliver long-term profitability and shareholder value.”
Doug Campbell
President and CEO
Key Operating Metrics
Dollars in thousands, except per share data. Dollar and percentage changes may not recalculate due to rounding. Charts may not be to scale.
An infographic accompanying this announcement is available at https://www.globenewswire.com/NewsRoom/AttachmentNg/bdaee810-0330-4474-aefa-099ec1f6e9b4
Note: Discussions in each section provide third quarter comparisons from fiscal year 2023 to fiscal year 2024.
TOTAL REVENUE – A 7.9% drop in revenue was primarily driven by the decrease in retail units sold. Interest income contributed favorably and was up 16.0% year-over-year. A portion of the decline in revenue was masked by the average retail sales price being up 7.5%.
SALES – Sales for the quarter were 11,664 units vs. 14,508 units, down 19.6% compared to the prior year quarter. Total credit application volume was down 8.3% year over year, which represented about half of the sales decline. Two fewer selling days during the quarter, and weather in January accounted for approximately 3-4% of the decrease in sales volume compared to the prior year quarter.
GROSS PROFIT – Gross profit per unit was $7,043, compared to $6,373 for the prior year’s third quarter. This improvement in gross profit per unit resulted from better operational execution in pricing discipline and continued improvements on the cost of vehicle repairs. The Company experienced headwinds in gross profit related to lower prices in the wholesale market and an increased volume of wholesale vehicles related to the higher credit losses in the prior quarter. Despite these headwinds, gross profits per retail until sold were still up 10.5% year-over-year.
NET CHARGE-OFFS – Net charge-offs as a percentage of average finance receivables were 6.8% compared to 5.9% during the prior year's third quarter. Sequentially, net charge-offs improved 40 basis points from 7.2% for the second quarter of fiscal 2024. As a reference, the quarterly performance of net charge-offs for the five-year period preceding the pandemic have ranged from 5.9% - 8.7%, signaling a return to more normal pre-pandemic levels. Both the frequency and severity of losses played an equal part in overall net charge-offs performance for the quarter. Delinquencies (accounts 30 days or more past due) improved year over year by 40 basis points to 3.3% of finance receivables as of January 31, 2024, and sequentially by 30 basis points from 3.6% of finance receivables as of October 31, 2023.
ALLOWANCE FOR CREDIT LOSSES – The Company decreased the allowance for credit loss as a percentage of finance receivables, net of deferred revenue and pending accident protection plan claims, from 26.04% at October 31, 2023 to 25.74% at January 31, 2024, providing a $3.9 million benefit to the provision for credit losses during the current quarter, resulting in a positive impact to basic earnings (loss) per share of $0.50. The key drivers of the adjustment were a lower overall inflationary outlook and lower delinquencies at quarter end.
UNDERWRITING – A majority of sales originated during the quarter were through our new LOS. The Company continued to enhance and update processes within the system to attract higher down-payments, shorter terms, and a stronger consumer profile relative to its legacy system. The average originating term for the quarter was 43.3 months, down from the sequential quarter at 44.1 months. This was up from an average term of 42.5 months for the prior year's third quarter.
SG&A EXPENSE – SG&A expense was $43.6 million compared to $44.7 million for the prior year quarter. This also delivered a $1.3 million benefit sequentially aided by the cost control activities implemented in the previous quarter. These actions assisted in bringing SG&A per average account down 6.7% ($421 compared to $451) compared to the prior year period. We continue to focus on expense management and the overall efficiency of the business.
ACQUISITIONS – The Company completed the purchase of Central Auto Sales in Hot Springs, Arkansas, which was announced in December. We are actively working on other opportunities we expect to materialize during the calendar year.
TRANSACTION – In February, the Company entered into a strategic partnership with Cox Automotive which is expected to drive better outcomes regarding vehicle acquisition, reconditioning, transportation, and remarketing activities. Cox Automotive is recognized as the world’s largest automotive services and technology provider.
FINANCING – The Company paid off its April 2022 asset-backed non-recourse notes during the quarter. During the quarter, Kroll Bond Rating Agency upgraded the rating on all notes from our 2023-1 issuance. Lastly, we completed our fourth asset-backed non-recourse term securitization on January 31, 2024, issuing $250 million in bonds with a weighted average fixed coupon rate of 9.5%. The net proceeds were used to pay outstanding debt and make the initial deposits into the related collection and reserve accounts to benefit the noteholders.
Subsequent to quarter end, the Company renewed and extended its revolving credit agreement to September 2025 with a total commitment of $340 million with a group of seven banks.
CASH-ON-CASH RETURNS – The Company continues to originate finance receivable pools with attractive cash-on-cash returns. The following table provides details regarding the cash-on-cash returns for our existing loan pools:
| Cash-on-Cash Returns1 |
|
| ||
Loan Origination Year | Prior Projected | Current Projected/Actual | Variance | Projected IRR2 | % of A/R Remaining |
FY2017 | * | 61.0% | * | 63.3% | 0.0% |
FY2018 | * | 67.6% | * | 67.4% | 0.0% |
FY2019 | * | 69.9% | * | 69.2% | 0.1% |
FY2020 | * | 74.0% | * | 66.4% | 0.4% |
FY2021 | 75.0% | 73.6% | -1.4% | 56.4% | 4.7% |
FY2022 | 61.0% | 58.3% | -2.7% | 41.1% | 19.8% |
FY2023 | 56.7% | 55.0% | -1.7% | 36.2% | 43.9% |
FY2024 | 59.5% | 61.3% | 1.8% | 37.2% | 80.4% |
|
|
|
|
|
|
* 2017 -2020 Pools' Current Projection reflects actual cash-on-cash returns |
| ||||
|
|
|
|
|
|
1 "Cash-on-cash returns" represent the return on cash invested by the Company in the vehicle finance loans the Company originates and is calculated with respect to a pool of loans (or finance receivables) by dividing total “cash in” less “cash out” by total “cash out” with respect to such pool. “Cash in” represents the total cash the Company expects to collect on the pool of finance receivables, including credit losses. This includes down-payments, principal and interest collected (including special and seasonal payments) and the fair market value of repossessed vehicles, if applicable. “Cash out” includes purchase price paid by the Company to acquire the vehicle (including reconditioning and transportation costs), and all other post-sale expenses as well as expenses related to our ancillary products. The calculation assumes estimates on expected credit losses net of fair market value of repossessed vehicles and the related timing of such losses as well as post sales repair expenses and special payments. The Company evaluates and updates expected credit losses quarterly. The credit quality of each pool is monitored and compared to prior and initial forecasts and is reflected in our on-going internal cash-on-cash projections.
Key Operating Results
|
| Three Months Ended |
|
| ||||||||||
|
| January 31, |
|
| ||||||||||
|
| 2024 |
| 2023 |
| % Change | ||||||||
Operating Data: |
|
|
|
|
|
| ||||||||
Retail units sold |
|
| 11,664 |
|
|
| 14,508 |
|
| (19.6 | )% | |||
Average number of stores in operation |
|
| 154 |
|
|
| 155 |
|
| (0.6 | ) | |||
Average retail units sold per store per month |
|
| 25.2 |
|
|
| 31.2 |
|
| (19.2 | ) | |||
Average retail sales price |
| $ | 19,455 |
|
| $ | 18,091 |
|
| 7.5 |
| |||
Total gross profit per retail unit sold |
| $ | 7,043 |
|
| $ | 6,373 |
|
| 10.5 |
| |||
Total gross profit percentage |
|
| 34.2% |
|
|
| 33.7% |
|
|
| ||||
Same store revenue growth |
|
| (9.3) |
|
|
| 12.3% |
|
|
| ||||
Net charge-offs as a percent of average finance receivables |
|
| 6.8% |
|
|
| 5.9% |
|
|
| ||||
Total collected (principal, interest and late fees) |
| $ | 167,664 |
|
| $ | 153,376 |
|
| 9.3 |
| |||
Average total collected per active customer per month |
| $ | 540 |
|
| $ | 519 |
|
| 4.0 |
| |||
Average percentage of finance receivables-current (excl. 1-2 day) |
|
| 80.3% |
|
|
| 79.4% |
|
|
| ||||
Average down-payment percentage |
|
| 5.1% |
|
|
| 4.8% |
|
|
| ||||
|
| Nine Months Ended |
|
| ||||||||||
|
| January 31, |
|
| ||||||||||
|
| 2024 |
| 2023 |
| % Change | ||||||||
Operating Data: |
|
|
|
|
|
| ||||||||
Retail units sold |
|
| 42,738 |
|
|
| 45,929 |
|
| (6.9 | )% | |||
Average number of stores in operation |
|
| 154 |
|
|
| 154 |
|
| - |
| |||
Average retail units sold per store per month |
|
| 30.8 |
|
|
| 33.1 |
|
| (6.9 | ) | |||
Average retail sales price |
| $ | 19,062 |
|
| $ | 18,059 |
|
| 5.6 |
| |||
Total gross profit per retail unit sold |
| $ | 6,867 |
|
| $ | 6,341 |
|
| 8.3 |
| |||
Total gross profit percentage |
|
| 34.4% |
|
|
| 33.5% |
|
|
| ||||
Same store revenue growth |
|
| 1.0% |
|
|
| 18.3% |
|
|
| ||||
Net charge-offs as a percent of average finance receivables |
|
| 20.0% |
|
|
| 16.9% |
|
|
| ||||
Total collected (principal, interest and late fees) |
| $ | 501,692 |
|
| $ | 452,362 |
|
| 10.9 |
| |||
Average total collected per active customer per month |
| $ | 536 |
|
| $ | 516 |
|
| 3.9 |
| |||
Average percentage of finance receivables-current (excl. 1-2 day) |
|
| 80.4% |
|
|
| 80.2% |
|
|
| ||||
Average down-payment percentage |
|
| 5.0% |
|
|
| 5.4% |
|
|
| ||||
Period End Data: |
|
|
|
|
|
| |||||
Stores open |
|
| 154 |
|
|
| 157 |
|
| (1.9 | )% |
Accounts over 30 days past due |
|
| 3.3% |
|
|
| 3.7% |
|
|
| |
Active customer count |
|
| 102,175 |
|
|
| 99,577 |
|
| 2.6 |
|
Principal balance of finance receivable |
| $ | 1,428,908 |
|
| $ | 1,305,956 |
|
| 9.4 |
|
Weighted average total contract term |
|
| 47.6 |
|
|
| 45.4 |
|
| 4.8 |
|
|
|
|
|
|
|
|
|
|
|
|
|
Conference Call and Webcast
The Company will hold a conference call to discuss its quarterly results on Friday, March 8, 2024, at 11 am ET. Participants may access the conference call via webcast using this link: Webcast Link. To participate via telephone, please register in advance using this Registration Link. Upon registration, all telephone participants will receive a one-time confirmation email detailing how to join the conference call, including the dial-in number along with a unique PIN that can be used to access the call. All participants are encouraged to dial in 10 minutes prior to the start time. A replay and transcript of the conference call and webcast will be available on-demand for 12 months.
About America’s Car-Mart, Inc.
America’s Car-Mart, Inc. (the “Company”) operates automotive dealerships in 12 states and is one of the largest publicly held automotive retailers in the United States focused exclusively on the “Integrated Auto Sales and Finance” segment of the used car market. The Company emphasizes superior customer service and the building of strong personal relationships with its customers. The Company operates its dealerships primarily in smaller cities throughout the South-Central United States, selling quality used vehicles and providing financing for substantially all of its customers. For more information about America’s Car-Mart, including investor presentations, please visit our website at www.car-mart.com.
Forward-Looking Statements
This news release contains “forward-looking statements” within the meaning of the Private Securities Litigation Reform Act of 1995. These forward-looking statements address the Company’s future objectives, plans and goals, as well as the Company’s intent, beliefs and current expectations regarding future operating performance and can generally be identified by words such as “may,” “will,” “should,” “could,” “expect,” “anticipate,” “intend,” “plan,” “foresee,” and other similar words or phrases. Specific events addressed by these forward-looking statements may include, but are not limited to:
operational infrastructure investments;
same dealership sales and revenue growth;
customer growth and engagement;
gross profit percentages;
gross profit per retail unit sold;
business acquisitions;
inventory acquisition, reconditioning, transportation and remarketing;
technological investments and initiatives;
future revenue growth;
receivables growth as related to revenue growth;
new dealership openings;
performance of new dealerships;
interest rates;
future credit losses;
the Company’s collection results, including but not limited to collections during income tax refund periods;
seasonality; and
the Company’s business, operating and growth strategies and expectations.
These forward-looking statements are based on the Company’s current estimates and assumptions and involve various risks and uncertainties. As a result, you are cautioned that these forward-looking statements are not guarantees of future performance, and that actual results could differ materially from those projected in these forward-looking statements. Factors that may cause actual results to differ materially from the Company’s projections include, but are not limited to:
general economic conditions in the markets in which the Company operates, including but not limited to fluctuations in gas prices, grocery prices and employment levels and inflationary pressure on operating costs;
the availability of quality used vehicles at prices that will be affordable to our customers, including the impacts of changes in new vehicle production and sales;
the ability to leverage the Cox Automotive services agreement to perform reconditioning and improve vehicle quality to reduce the average vehicle cost, improve gross margins, reduce credit loss and enhance cash flow;
the availability of credit facilities and access to capital through securitization financings or other sources on terms acceptable to us to support the Company’s business;
the Company’s ability to underwrite and collect its contracts effectively;
competition;
dependence on existing management;
ability to attract, develop, and retain qualified general managers;
changes in consumer finance laws or regulations, including but not limited to rules and regulations that have recently been enacted or could be enacted by federal and state governments;
the ability to keep pace with technological advances and changes in consumer behavior affecting our business;
security breaches, cyber-attacks, or fraudulent activity;
the ability to identify and obtain favorable locations for new or relocated dealerships at reasonable cost;
the ability to successfully identify, complete and integrate new acquisitions; and
potential business and economic disruptions and uncertainty that may result from any future public health crises and any efforts to mitigate the financial impact and health risks associated with such developments.
Additionally, risks and uncertainties that may affect future results include those described from time to time in the Company’s SEC filings. The Company undertakes no obligation to update or revise any forward-looking statements, whether as a result of new information, future events or otherwise. Readers are cautioned not to place undue reliance on these forward-looking statements, which speak only as of the dates on which they are made.
Contacts
Vickie Judy, CFO
479-464-9944
Investor_relations@car-mart.com
America’s Car-Mart | |||||||||||||||||||||||
Consolidated Results of Operations | |||||||||||||||||||||||
(Unaudited) | |||||||||||||||||||||||
| |||||||||||||||||||||||
(Amounts in thousands, except per share data) | |||||||||||||||||||||||
|
|
|
|
|
|
|
|
|
|
|
|
| As a % of Sales | ||||||||||
|
|
|
|
|
| Three Months Ended |
|
|
| Three Months Ended | |||||||||||||
|
|
|
|
|
| January 31, |
|
|
| January 31, | |||||||||||||
|
|
|
|
|
| 2024 |
| 2023 |
| % Change |
| 2024 |
| 2023 | |||||||||
Statements of Operations: |
|
|
|
|
|
|
|
|
|
|
|
|
| ||||||||||
Revenues: |
|
|
|
|
|
|
|
|
|
|
|
|
| ||||||||||
| Sales |
| $ | 240,401 |
|
| $ | 274,276 |
|
| (12.4 | )% |
| 100.0 | % |
| 100.0 | % | |||||
| Interest income |
|
| 59,213 |
|
|
| 51,063 |
|
| 16.0 |
|
|
| 24.6 |
|
|
| 18.6 |
| |||
|
|
|
| Total |
|
| 299,614 |
|
|
| 325,339 |
|
| (7.9 | ) |
|
| 124.6 |
|
|
| 118.6 |
|
|
|
|
|
|
|
|
|
|
|
|
|
|
|
|
|
|
| ||||||
Costs and expenses: |
|
|
|
|
|
|
|
|
|
|
|
|
| ||||||||||
| Cost of sales |
|
| 158,250 |
|
|
| 181,823 |
|
| (13.0 | ) |
|
| 65.8 |
|
|
| 66.3 |
| |||
| Selling, general and administrative |
|
| 43,562 |
|
|
| 44,737 |
|
| (2.6 | ) |
|
| 18.1 |
|
|
| 16.3 |
| |||
| Provision for credit losses |
|
| 89,582 |
|
|
| 85,650 |
|
| 4.6 |
|
|
| 37.3 |
|
|
| 31.2 |
| |||
| Interest expense |
|
| 16,731 |
|
|
| 9,765 |
|
| 71.3 |
|
|
| 7.0 |
|
|
| 3.6 |
| |||
| Depreciation and amortization |
|
| 1,712 |
|
|
| 1,537 |
|
| 11.4 |
|
|
| 0.7 |
|
|
| 0.6 |
| |||
| Loss on disposal of property and equipment |
| 119 |
|
|
| 68 |
|
| 75.0 |
|
|
| - |
|
|
| - |
| ||||
|
|
|
| Total |
|
| 309,956 |
|
|
| 323,580 |
|
| (4.2 | ) |
|
| 128.9 |
|
|
| 118.0 |
|
|
|
|
|
|
|
|
|
|
|
|
|
|
|
|
|
|
| ||||||
|
|
|
| Income (Loss) before taxes |
|
| (10,342 | ) |
|
| 1,759 |
|
|
|
|
| (4.3 | ) |
|
| 0.6 |
| |
|
|
|
|
|
|
|
|
|
|
|
|
|
|
|
|
|
| ||||||
Provision for income taxes |
|
| (1,800 | ) |
|
| 251 |
|
|
|
|
| (0.7 | ) |
|
| 0.1 |
| |||||
|
|
|
|
|
|
|
|
|
|
|
|
|
|
|
|
|
| ||||||
|
|
|
| Net income (loss) |
| $ | (8,542 | ) |
| $ | 1,508 |
|
|
|
|
| (3.6 | ) |
|
| 0.5 |
| |
|
|
|
|
|
|
|
|
|
|
|
|
|
|
|
|
|
| ||||||
Dividends on subsidiary preferred stock |
| $ | (10 | ) |
| $ | (10 | ) |
|
|
|
|
|
|
|
|
| ||||||
|
|
|
|
|
|
|
|
|
|
|
|
|
|
|
|
|
| ||||||
|
|
|
| Net income (loss) attributable to common shareholders |
| $ | (8,552 | ) |
| $ | 1,498 |
|
|
|
|
|
|
|
|
|
| ||
|
|
|
|
|
|
|
|
|
|
|
|
|
|
|
|
|
| ||||||
Earnings per share: |
|
|
|
|
|
|
|
|
|
|
|
|
| ||||||||||
| Basic |
| $ | (1.34 | ) |
| $ | 0.24 |
|
|
|
|
|
|
|
|
|
| |||||
| Diluted |
| $ | (1.34 | ) |
| $ | 0.23 |
|
|
|
|
|
|
|
|
|
| |||||
|
|
|
|
|
|
|
|
|
|
|
|
|
|
|
|
|
| ||||||
Weighted average number of shares used in calculation: |
|
|
|
|
|
|
|
|
|
|
| ||||||||||||
| Basic |
|
| 6,393,080 |
|
|
| 6,370,031 |
|
|
|
|
|
|
|
|
|
| |||||
| Diluted |
|
| 6,393,080 |
|
|
| 6,536,785 |
|
|
|
|
|
|
|
|
|
| |||||
America’s Car-Mart | ||||||||||||||||||||||
Consolidated Results of Operations | ||||||||||||||||||||||
(Unaudited) | ||||||||||||||||||||||
| ||||||||||||||||||||||
(Amounts in thousands, except per share data) | ||||||||||||||||||||||
|
|
|
|
|
|
|
|
|
|
|
| As a % of Sales | ||||||||||
|
|
|
|
| Nine Months Ended |
|
|
| Nine Months Ended | |||||||||||||
|
|
|
|
| January 31, |
|
|
| January 31, | |||||||||||||
|
|
|
|
| 2024 |
| 2023 |
| % Change |
| 2024 |
| 2023 | |||||||||
Statements of Operations: |
|
|
|
|
|
|
|
|
|
|
|
|
| |||||||||
Revenues: |
|
|
|
|
|
|
|
|
|
|
|
|
| |||||||||
| Sales |
| $ | 854,170 |
|
| $ | 869,775 |
|
| (1.8 | )% |
| 100.0 | % |
| 100.0 | % | ||||
| Interest income |
|
| 175,051 |
|
|
| 143,690 |
|
| 21.8 |
|
|
| 20.5 |
|
|
| 16.5 |
| ||
|
|
| Total |
|
| 1,029,221 |
|
|
| 1,013,465 |
|
| 1.6 |
|
|
| 120.5 |
|
|
| 116.5 |
|
|
|
|
|
|
|
|
|
|
|
|
|
|
|
|
|
| ||||||
Costs and expenses: |
|
|
|
|
|
|
|
|
|
|
|
|
| |||||||||
| Cost of sales |
|
| 560,692 |
|
|
| 578,547 |
|
| (3.1 | ) |
|
| 65.6 |
|
|
| 66.5 |
| ||
| Selling, general and administrative |
|
| 134,895 |
|
|
| 130,881 |
|
| 3.1 |
|
|
| 15.8 |
|
|
| 15.0 |
| ||
| Provision for credit losses |
|
| 321,300 |
|
|
| 250,719 |
|
| 28.2 |
|
|
| 37.6 |
|
|
| 28.8 |
| ||
| Interest expense |
|
| 47,587 |
|
|
| 25,460 |
|
| 86.9 |
|
|
| 5.6 |
|
|
| 2.9 |
| ||
| Depreciation and amortization |
|
| 5,101 |
|
|
| 3,997 |
|
| 27.6 |
|
|
| 0.6 |
|
|
| 0.5 |
| ||
| Loss on disposal of property and equipment |
| 359 |
|
|
| 320 |
|
| 12.2 |
|
|
| - |
|
|
| - |
| |||
|
|
| Total |
|
| 1,069,934 |
|
|
| 989,924 |
|
| 8.1 |
|
|
| 125.3 |
|
|
| 113.8 |
|
|
|
|
|
|
|
|
|
|
|
|
|
|
|
|
|
| ||||||
|
|
| Income (Loss) before taxes |
|
| (40,713 | ) |
|
| 23,541 |
|
|
|
|
| (4.8 | ) |
|
| 2.7 |
| |
|
|
|
|
|
|
|
|
|
|
|
|
|
|
|
|
| ||||||
Provision for income taxes |
|
| (8,894 | ) |
|
| 5,197 |
|
|
|
|
| (1.0 | ) |
|
| 0.6 |
| ||||
|
|
|
|
|
|
|
|
|
|
|
|
|
|
|
|
| ||||||
|
|
| Net income (loss) |
| $ | (31,819 | ) |
| $ | 18,344 |
|
|
|
|
| (3.7 | ) |
|
| 2.1 |
| |
|
|
|
|
|
|
|
|
|
|
|
|
|
|
|
|
| ||||||
Dividends on subsidiary preferred stock |
| $ | (30 | ) |
| $ | (30 | ) |
|
|
|
|
|
|
|
|
| |||||
|
|
|
|
|
|
|
|
|
|
|
|
|
|
|
|
| ||||||
|
|
| Net income (loss) attributable to common shareholders |
| $ | (31,849 | ) |
| $ | 18,314 |
|
|
|
|
|
|
|
|
|
| ||
|
|
|
|
|
|
|
|
|
|
|
|
|
|
|
|
| ||||||
Earnings per share: |
|
|
|
|
|
|
|
|
|
|
|
|
| |||||||||
| Basic |
| $ | (4.99 | ) |
| $ | 2.87 |
|
|
|
|
|
|
|
|
|
| ||||
| Diluted |
| $ | (4.99 | ) |
| $ | 2.79 |
|
|
|
|
|
|
|
|
|
| ||||
|
|
|
|
|
|
|
|
|
|
|
|
|
|
|
|
| ||||||
Weighted average number of shares used in calculation: |
|
|
|
|
|
|
|
|
|
|
| |||||||||||
| Basic |
|
| 6,386,997 |
|
|
| 6,370,732 |
|
|
|
|
|
|
|
|
|
| ||||
| Diluted |
|
| 6,386,997 |
|
|
| 6,562,214 |
|
|
|
|
|
|
|
|
|
| ||||
America's Car-Mart, Inc. | ||||||||||||||
Condensed Consolidated Balance Sheet and Other Data | ||||||||||||||
(Unaudited) | ||||||||||||||
| ||||||||||||||
(Amounts in thousands, except per share data) |
|
|
|
|
| |||||||||
|
|
|
| January 31, |
| April 30, |
| January 31, | ||||||
|
|
|
| 2024 |
| 2023 |
| 2023 | ||||||
|
|
|
|
|
|
|
|
| ||||||
Cash and cash equivalents |
| $ | 4,239 |
|
| $ | 9,796 |
|
| $ | 4,322 |
| ||
Restricted cash from collections on auto finance receivables | $ | 90,350 |
|
| $ | 58,238 |
|
| $ | 61,148 |
| |||
Finance receivables, net (1) |
| $ | 1,085,772 |
|
| $ | 1,063,460 |
|
| $ | 1,012,580 |
| ||
Inventory |
|
| $ | 109,313 |
|
| $ | 109,290 |
|
| $ | 131,616 |
| |
Total assets (1) |
| $ | 1,466,947 |
|
| $ | 1,414,737 |
|
| $ | 1,379,519 |
| ||
Revolving lines of credit, net |
| $ | 55,374 |
|
| $ | 167,231 |
|
| $ | 27,782 |
| ||
Non-recourse notes payable, net |
| $ | 684,688 |
|
| $ | 471,367 |
|
| $ | 588,310 |
| ||
Treasury stock |
| $ | 297,757 |
|
| $ | 297,421 |
|
| $ | 297,421 |
| ||
Total equity |
| $ | 469,007 |
|
| $ | 498,547 |
|
| $ | 495,244 |
| ||
Shares outstanding |
|
| 6,391,061 |
|
|
| 6,373,404 |
|
|
| 6,370,031 |
| ||
Book value per outstanding share | $ | 73.45 |
|
| $ | 78.29 |
|
| $ | 77.81 |
| |||
|
|
|
|
|
|
|
|
| ||||||
Allowance as % of principal balance net of deferred revenue |
| 25.74% |
|
|
| 23.91% |
|
|
| 23.65% |
| |||
|
|
|
|
|
|
|
|
| ||||||
|
|
|
|
|
|
|
|
| ||||||
Changes in allowance for credit losses: |
|
|
|
|
| |||||||||
|
|
|
| Nine months ended |
|
| ||||||||
|
|
|
| January 31, |
|
| ||||||||
|
|
|
| 2024 |
| 2023 |
|
| ||||||
Balance at beginning of period |
| $ | 299,608 |
|
| $ | 237,823 |
|
|
| ||||
Provision for credit losses |
|
| 321,300 |
|
|
| 250,719 |
|
|
| ||||
Charge-offs, net of collateral recovered |
| (285,921 | ) |
|
| (205,767 | ) |
|
| |||||
Balance at end of period |
| $ | 334,987 |
|
| $ | 282,775 |
|
|
| ||||
|
|
|
|
|
|
|
|
| ||||||
(1) Some items in the prior year financial statements were reclassified to conform to the current presentation. Reclassification had no effect on the prior year net income or shareholder’s equity | ||||||||||||||
|
|
|
|
|
|
|
|
| ||||||
America's Car-Mart, Inc. | |||||||||
Condensed Consolidated Statements of Cash Flows | |||||||||
(Unaudited) | |||||||||
(Amounts in thousands) |
|
|
| ||||||
|
|
| Nine months ended | ||||||
|
|
| January 31, | ||||||
|
|
| 2024 |
| 2023 | ||||
|
|
|
|
|
| ||||
Operating activities: |
|
|
| ||||||
| Net income (loss) | $ | (31,819 | ) |
| $ | 18,344 |
| |
| Provision for credit losses |
| 321,300 |
|
|
| 250,719 |
| |
| Losses on claims for accident protection plan |
| 24,480 |
|
|
| 17,717 |
| |
| Depreciation and amortization |
| 5,101 |
|
|
| 3,997 |
| |
| Finance receivable originations |
| (794,477 | ) |
|
| (841,445 | ) | |
| Finance receivable collections |
| 324,703 |
|
|
| 308,671 |
| |
| Inventory |
| 103,451 |
|
|
| 76,933 |
| |
| Deferred accident protection plan revenue |
| (1,926 | ) |
|
| 13,987 |
| |
| Deferred service contract revenue |
| (130 | ) |
|
| 17,565 |
| |
| Income taxes, net |
| (10,735 | ) |
|
| 252 |
| |
| Other(1) |
| (3,120 | ) |
|
| 9,304 |
| |
|
| Net cash used in operating activities |
| (63,172 | ) |
|
| (123,956 | ) |
|
|
|
|
|
| ||||
Investing activities: |
|
|
| ||||||
| Purchase of investments |
| (4,815 | ) |
|
| (5,499 | ) | |
| Purchase of property and equipment and other(1) |
| (4,514 | ) |
|
| (18,918 | ) | |
|
| Net cash used in investing activities |
| (9,329 | ) |
|
| (24,417 | ) |
|
|
|
|
|
| ||||
Financing activities: |
|
|
| ||||||
| Change in revolving credit facility, net |
| (112,522 | ) |
|
| (17,599 | ) | |
| Payments on non-recourse notes payable |
| (394,450 | ) |
|
| (209,327 | ) | |
| Change in cash overdrafts |
| 2,183 |
|
|
| 3,795 |
| |
| Issuances of non-recourse notes payable |
| 610,340 |
|
|
| 400,176 |
| |
| Debt issuance costs |
| (5,892 | ) |
|
| (2,001 | ) | |
| Purchase of common stock |
| (336 | ) |
|
| (5,196 | ) | |
| Dividend payments |
| (30 | ) |
|
| (30 | ) | |
| Exercise of stock options and issuance of common stock |
| (237 | ) |
|
| 1,438 |
| |
|
| Net cash provided by financing activities |
| 99,056 |
|
|
| 171,256 |
|
|
|
|
|
|
| ||||
Increase in cash, cash equivalents, and restricted cash | $ | 26,555 |
|
| $ | 22,883 |
| ||
|
|
|
|
|
| ||||
|
|
|
|
|
| ||||
(1) | Prepaid expenses and other assets at January 31, 2023, reflects an immaterial reclassification of approximately $8.9 million of capitalized implementation costs related to a cloud-computing arrangement previously recorded in property and equipment, net, and did not impact operating income. | ||||||||
| |||||||||

