How Do Americans Spend Their Monthly Income?

After taxes, what is the average American’s monthly income? And, perhaps more importantly, how is that income spent? Finally, how does this differ from generation to generation?
LendEDU looked to answer these questions by surveying 1,000 adult Americans about what their monthly take-home pay is and how those dollars are spent on things like mortgage or insurance payments, and living necessities like groceries.
The results produced some data points that you would expect; for example, millennials are paying the most each month towards student loans, while that debt is nearly nonexistent for baby boomers.
But there were also some surprises that go against the traditional narrative, including millennials being the most actively involved in everyday investing, while also still equaling Generation X’s monthly retirement contribution percentage.
Let’s get into the data.
The data: How Americans are spending their monthly income
(Results are based on an online survey of 1,000 adult Americans that was commissioned by LendEDU and conducted online by Pollfish. Generational breakdowns were done according the latest information from Pew Research Center. Silent generation respondents were grouped with baby boomers, while Generation Z respondents were grouped with millennials due to a limited sample size for the silent generation and Generation Z.
The graphic below presents four different bars: one representing the overall average percentage breakdowns, and each of the next three representing a specific generation. Each percentage is a proportion of the average monthly income reported from the overall respondent pool and the three respective generations.
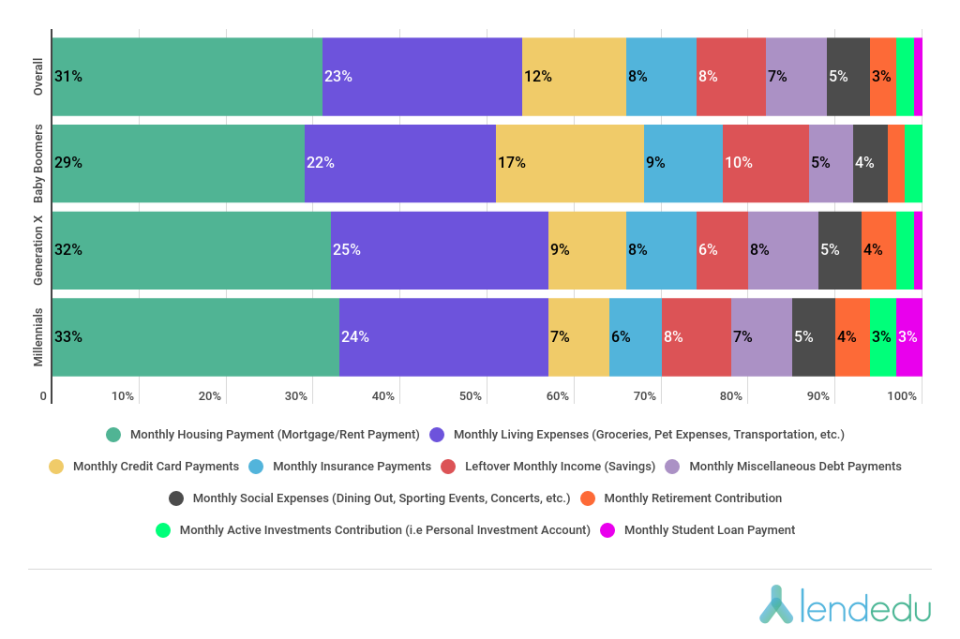
Here are four different charts: one representing the overall respondent average, and the next three each representing a specific generation.
The average monthly income figure for each chart is listed in the tab and inside the chart.
The various colors each represent a different expense, and by hovering over each, you can see the average dollar amount spent each month on that expense, in addition to the percentage breakdown.
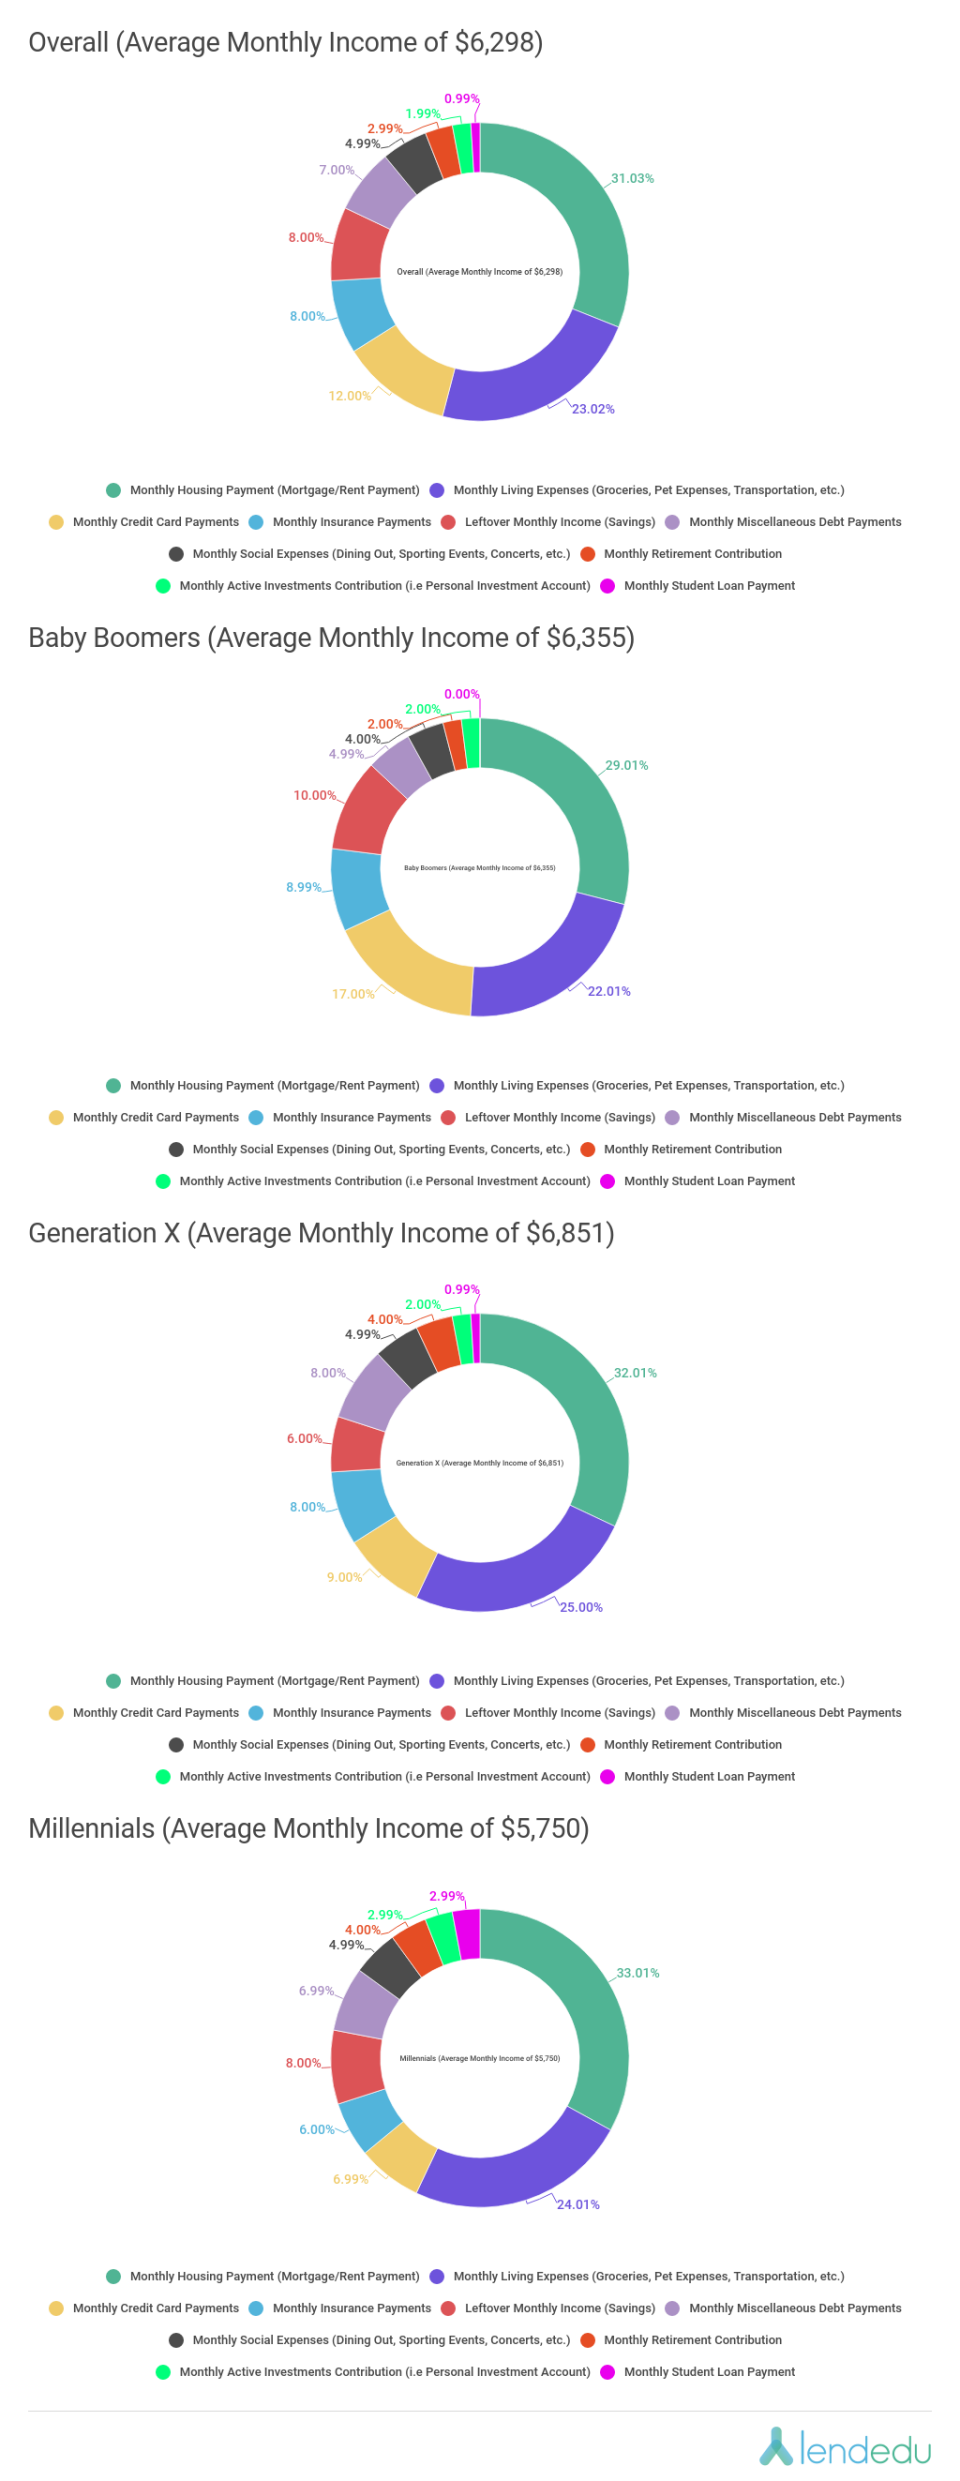
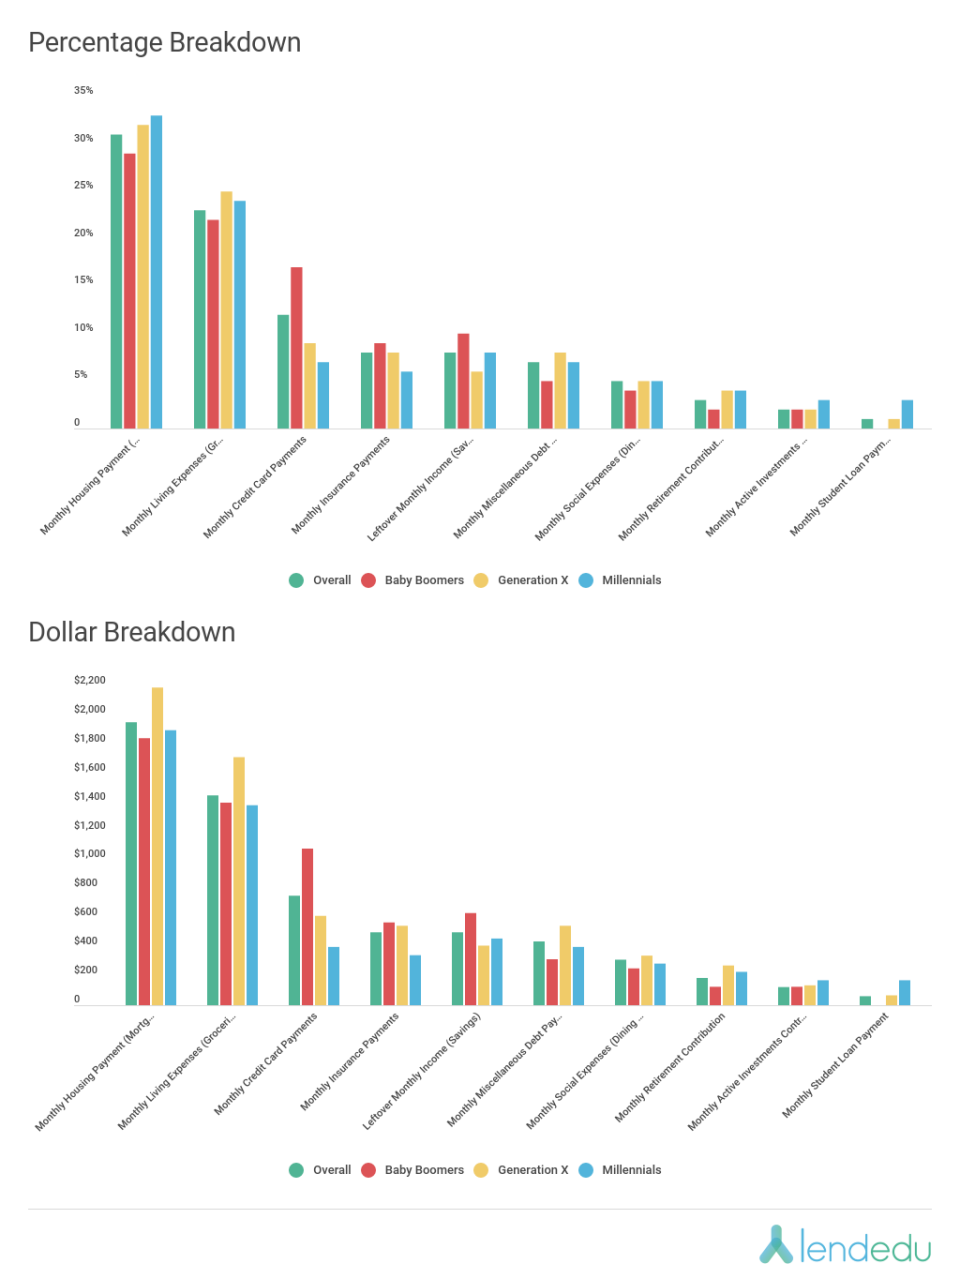
Here you can see either the percentage or dollar breakdown for not only how the overall respondent pool spends monthly income, but how each respective generation does as well.
Key findings
Not surprisingly, millennials have the biggest financial commitment when it comes to student loan debt. From month to month, this generation is contributing 3% of their income to student loan payments compared to Generation X (1%) and baby boomers (0%).
By a wide margin, baby boomers were dedicating the largest proportion of their monthly income to credit card payments (17%) compared to Generation X (9%) and millennials (7%).
Considering all monthly debt payments other than those associated with housing (credit card, student loan, miscellaneous), baby boomers proportionally had the largest month-to-month commitment (22%), compared to Generation X (18%) and millennials (17%).
However, baby boomers are able to save the largest percentage of their income from month to month (10%) compared to Generation X (6%) and millennials (8%).
In terms of average monthly income, Generation X led the way ($6,851), followed by baby boomers ($6,355), and millennials ($5,750).
Dispelling a common myth that millennials spend frivolously, this generation uses 5% of their monthly income for entertainment expenses, compared to baby boomers (4%) and Generation X (5%).
On average millennials were proportionally putting the most towards active investments other than those made for retirement accounts (4%), compared to baby boomers (2%) and Generation X (2%).
When it came to retirement contributions, both millennials and Generation X were putting 4% of their monthly income, while boomers were putting 2%.
Considering all investment accounts (retirement and active/personal), millennials were contributing the most month to month (8%), compared to baby boomers (4%) and Generation X (6%).
In general, all three generations were sticking close to the 28 part of the 28/36 rule which calls for committing a maximum of 28% of income to housing costs. Millennials were committing 33%, compared to baby boomers (29%) and Generation X (32%).
Sticking with the 28/36 rule, all generations paid much more than 36% maximum proportion of their income to all debt payments. Boomers had the largest month-to-month debt commitment (51%), while both Generation X and millennials were at 50%.
Across the board, living expenses accounted for the second largest month-to-month expense. Millennials were dedicating 24%, compared to 25% from Generation X and 22% from baby boomers.
Baby boomers had the largest insurance commitment in terms of percentages (9%), while Generation X (8%) and millennials (6%) were not far behind.
Methodology
The results discussed in this survey were based on a survey of 1,000 adult Americans ages 18 and up. The survey was commissioned by LendEDU and conducted online by polling company Pollfish.
Properly-aged respondents were found using Pollfish’s age filtering feature. The generational breakdowns were completed according to the latest information from Pew Research Center. The silent generation respondents were grouped with baby boomers, while Generation Z respondents were grouped with millennials due to a limited sample size for the silent generation and Generation Z.
This particular survey was conducted over a five-day span, starting on Sept. 23, 2019, and ending on Sept. 27, 2019. All respondents were asked to answer all questions truthfully and to the best of their abilities.
The post How Do Americans Spend Their Monthly Income? appeared first on LendEDU.
