Amphenol (APH)'s True Worth: A Comprehensive Analysis of Its Market Value
Amphenol Corp (NYSE:APH) has seen a daily loss of -2.27% and a 3-month loss of -3.25%. Its Earnings Per Share (EPS) stands at 3.07. But is the stock fairly valued? This article aims to answer this question by providing an in-depth analysis of Amphenol's valuation. Read on to understand better the intrinsic value of Amphenol.
Company Overview
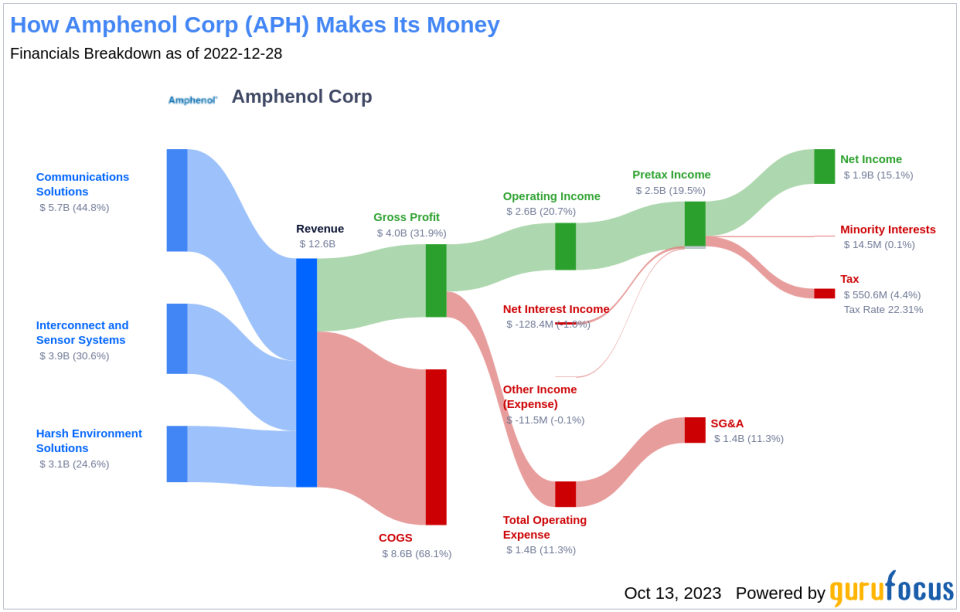
Amphenol is a global supplier of connectors, sensors, and interconnect systems. The company holds the second-largest connector market share worldwide, selling into various end markets, including automotive, broadband, commercial air, industrial, IT and data communications, military, mobile devices, and mobile networks. With operations in 40 countries, Amphenol has a diversified geographical presence.
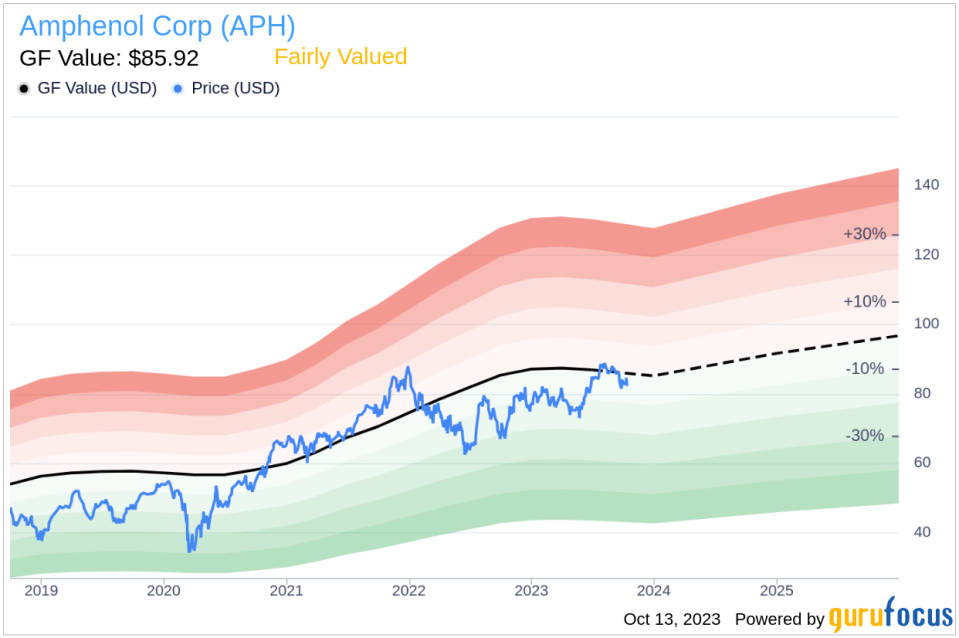
Amphenol (NYSE:APH) is currently priced at $82.23 per share, with a market cap of $49 billion. Compared to the GF Value of $85.92, the stock appears to be fairly valued. But to get a clearer picture, let's dive deeper into the GF Value calculation.
Understanding GF Value
The GF Value is a unique measure of a stock's intrinsic value, calculated based on historical trading multiples, a GuruFocus adjustment factor, and future business performance estimates. The GF Value Line provides an overview of the stock's ideal fair trading value.
According to the GF Value, Amphenol seems to be fairly valued. The GF Value is derived from historical multiples, an internal adjustment based on the company's past business growth, and analyst estimates of future business performance. If the stock's share price is significantly above the GF Value Line, the stock may be overvalued, indicating potentially poor future returns. Conversely, if the stock's share price is significantly below the GF Value Line, the stock may be undervalued, indicating potentially high future returns.
Given that Amphenol is fairly valued, the long-term return of its stock is likely to be close to the rate of its business growth.
Link: These companies may deliver higher future returns at reduced risk.
Financial Strength
Investing in companies with poor financial strength carries a higher risk of permanent capital loss. Therefore, reviewing a company's financial strength is crucial before deciding to invest in its stock. A good starting point is the cash-to-debt ratio and interest coverage. Amphenol has a cash-to-debt ratio of 0.35, which is worse than 79.98% of 2363 companies in the Hardware industry. However, GuruFocus ranks Amphenol's overall financial strength at 7 out of 10, indicating fair financial strength.
Profitability and Growth
Investing in profitable companies, especially those with consistent profitability over the long term, carries less risk. A company with high profit margins is typically a safer investment than one with low profit margins. Amphenol has been profitable 10 over the past 10 years, with a revenue of $12.60 billion and Earnings Per Share (EPS) of $3.07 in the past twelve months. Its operating margin is 20.61%, ranking better than 93.33% of 2444 companies in the Hardware industry. Overall, GuruFocus ranks Amphenol's profitability at 10 out of 10, indicating strong profitability.
Growth is one of the most critical factors in a company's valuation. According to GuruFocus research, long-term stock performance is closely correlated with growth. Companies that grow faster create more value for shareholders, especially if that growth is profitable. Amphenol's average annual revenue growth is 15%, ranking better than 78.49% of 2325 companies in the Hardware industry. The 3-year average EBITDA growth is 15.5%, ranking better than 58.7% of 1954 companies in the Hardware industry.
ROIC vs WACC
One can also evaluate a company's profitability by comparing its return on invested capital (ROIC) to its weighted average cost of capital (WACC). Return on invested capital (ROIC) measures how well a company generates cash flow relative to the capital it has invested in its business. The weighted average cost of capital (WACC) is the rate that a company is expected to pay on average to all its security holders to finance its assets. If the return on invested capital exceeds the weighted average cost of capital, the company is likely creating value for its shareholders. During the past 12 months, Amphenol's ROIC is 18.08 while its WACC came in at 10.7.
Conclusion
In summary, the stock of Amphenol (NYSE:APH) shows every sign of being fairly valued. The company's financial condition is fair, and its profitability is strong. Its growth ranks better than 58.7% of 1954 companies in the Hardware industry. To learn more about Amphenol stock, you can check out its 30-Year Financials here.
To find out the high-quality companies that may deliver above-average returns, please check out GuruFocus High Quality Low Capex Screener.
This article, generated by GuruFocus, is designed to provide general insights and is not tailored financial advice. Our commentary is rooted in historical data and analyst projections, utilizing an impartial methodology, and is not intended to serve as specific investment guidance. It does not formulate a recommendation to purchase or divest any stock and does not consider individual investment objectives or financial circumstances. Our objective is to deliver long-term, fundamental data-driven analysis. Be aware that our analysis might not incorporate the most recent, price-sensitive company announcements or qualitative information. GuruFocus holds no position in the stocks mentioned herein.
This article first appeared on GuruFocus.
