Amphenol Corporation's (NYSE:APH) Stock's On An Uptrend: Are Strong Financials Guiding The Market?
Amphenol (NYSE:APH) has had a great run on the share market with its stock up by a significant 9.5% over the last month. Given that the market rewards strong financials in the long-term, we wonder if that is the case in this instance. In this article, we decided to focus on Amphenol's ROE.
Return on Equity or ROE is a test of how effectively a company is growing its value and managing investors’ money. In simpler terms, it measures the profitability of a company in relation to shareholder's equity.
View our latest analysis for Amphenol
How Is ROE Calculated?
The formula for return on equity is:
Return on Equity = Net Profit (from continuing operations) ÷ Shareholders' Equity
So, based on the above formula, the ROE for Amphenol is:
26% = US$1.9b ÷ US$7.4b (Based on the trailing twelve months to March 2023).
The 'return' is the income the business earned over the last year. Another way to think of that is that for every $1 worth of equity, the company was able to earn $0.26 in profit.
What Is The Relationship Between ROE And Earnings Growth?
So far, we've learned that ROE is a measure of a company's profitability. We now need to evaluate how much profit the company reinvests or "retains" for future growth which then gives us an idea about the growth potential of the company. Assuming everything else remains unchanged, the higher the ROE and profit retention, the higher the growth rate of a company compared to companies that don't necessarily bear these characteristics.
Amphenol's Earnings Growth And 26% ROE
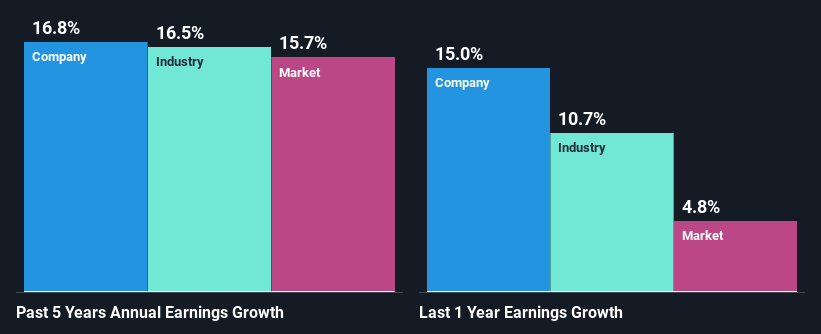
Firstly, we acknowledge that Amphenol has a significantly high ROE. Second, a comparison with the average ROE reported by the industry of 12% also doesn't go unnoticed by us. This probably laid the groundwork for Amphenol's moderate 17% net income growth seen over the past five years.
As a next step, we compared Amphenol's net income growth with the industry and found that the company has a similar growth figure when compared with the industry average growth rate of 16% in the same period.
Earnings growth is a huge factor in stock valuation. It’s important for an investor to know whether the market has priced in the company's expected earnings growth (or decline). Doing so will help them establish if the stock's future looks promising or ominous. If you're wondering about Amphenol's's valuation, check out this gauge of its price-to-earnings ratio, as compared to its industry.
Is Amphenol Making Efficient Use Of Its Profits?
Amphenol has a healthy combination of a moderate three-year median payout ratio of 25% (or a retention ratio of 75%) and a respectable amount of growth in earnings as we saw above, meaning that the company has been making efficient use of its profits.
Additionally, Amphenol has paid dividends over a period of at least ten years which means that the company is pretty serious about sharing its profits with shareholders. Based on the latest analysts' estimates, we found that the company's future payout ratio over the next three years is expected to hold steady at 28%. Accordingly, forecasts suggest that Amphenol's future ROE will be 23% which is again, similar to the current ROE.
Conclusion
Overall, we are quite pleased with Amphenol's performance. Specifically, we like that the company is reinvesting a huge chunk of its profits at a high rate of return. This of course has caused the company to see substantial growth in its earnings. That being so, a study of the latest analyst forecasts show that the company is expected to see a slowdown in its future earnings growth. To know more about the latest analysts predictions for the company, check out this visualization of analyst forecasts for the company.
Have feedback on this article? Concerned about the content? Get in touch with us directly. Alternatively, email editorial-team (at) simplywallst.com.
This article by Simply Wall St is general in nature. We provide commentary based on historical data and analyst forecasts only using an unbiased methodology and our articles are not intended to be financial advice. It does not constitute a recommendation to buy or sell any stock, and does not take account of your objectives, or your financial situation. We aim to bring you long-term focused analysis driven by fundamental data. Note that our analysis may not factor in the latest price-sensitive company announcements or qualitative material. Simply Wall St has no position in any stocks mentioned.
Join A Paid User Research Session
You’ll receive a US$30 Amazon Gift card for 1 hour of your time while helping us build better investing tools for the individual investors like yourself. Sign up here
