Analysis: USD/CAD Breakout?
To receive other reports from this author via e-mail, sign up to Kristian’s e-mail distribution list via this link.
USD/CAD has undergone an impressive run higher over the past couple of weeks as the exchange rate traded to its highest level in over a year and half earlier this week. With the 2011 high now within striking distance of this high water mark, a continuation of this trend higher looks probable once short-term overbought readings are worked off. A natural pivot for this next move higher looks to be where the recent advance stalled as the 1.0540/55 area marks a convergence of the 88.6% retracement of the 2011 to 2012 decline and the 100% projection of the January to March advance as measured from the early May low. Traction back above this level over the next few days should be the "tell" and trigger an important upside resumption. We like buying the pair on break with a fairly tight stop.
USD/CAD Daily Chart: June 27, 2013

Charts Created using Marketscope – Prepared by Kristian Kerr
Key Event Risk Next Week:
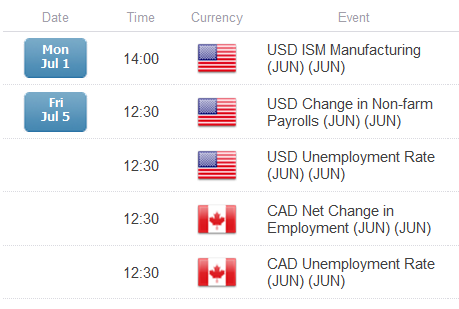
Source: DailyFX Calendar
LEVELS TO WATCH
Resistance: 1.0540 (Fibonacci), 1.0610 (Gann)
Support: 1.0440 (Fibonacci), 1.0410 (Gann)
STRATEGY – Buy USD/CAD on a break above 1.0560
Entry: Break of 1.0560
Stop: 1.0509
Target 1: 1.0665
Target 2: 1.0700
--- Written by Kristian Kerr, Senior Currency Strategist for DailyFX.com
Are you looking for other ways to pinpoint support and resistance levels? Take our free tutorial on using Fibonacci retracements.
To contact Kristian, e-mail kkerr@fxcm.com. Follow me on Twitter at@KKerrFX.
.
DailyFX provides forex news and technical analysis on the trends that influence the global currency markets.
Learn forex trading with a free practice account and trading charts from FXCM.
