Use New Analyst Coverage to Find Great Stocks to Buy for September
The market ripped higher on Tuesday to help both the S&P 500 and the Nasdaq retake their 50-day moving averages through mid-day trading. The bulls are now fighting to regain control after the healthy August pullback and are diving back into Tesla, Nvidia, and other growth stocks.
The 50-day moving average is a bullish line in the sand that investors should be paying close attention to since the 200-day is such a long way down. The next major near-term catalysts that could possibly bring a flurry of buying or selling are the release of the Fed’s preferred inflation gauge (the PCE) on Thursday morning, followed by the August jobs report on Friday.
Wall Street is growing more hopeful that the Fed will be able to achieve that coveted soft landing. The lower-than-projected job openings data on Tuesday helps show the economy is continuing to cool while remaining resilient. And investors should be pleased the Fed isn’t growing complacent since slightly higher rates for longer is a far better scenario than rebounding inflation.
On top of all that, the market made it through Q2 earnings season with the outlook for earnings firmly intact. The second quarter is not only set to mark the bottom, the fourth quarter is projected to represent the beginning of a huge comeback. S&P 500 earnings are projected to surge 11.6% in 2024 and climb 11% higher in 2025 vs. a projected -3.7% drop this year, according to Zacks data.
Therefore, investors likely want to stay exposed to the stock market in September and beyond. One way for investors to find potentially market-beating stocks to buy is to search for stocks gaining analyst coverage.
The idea is pretty simple: analysts are more inclined to start covering a stock that they view as having substantial upside potential vs. picking up coverage only to say stay away.
Here is how to use our new analyst coverage screen to find stocks to buy in September and beyond.
New Analyst Coverage
Broker recommendations play their part no matter how investors feel about them. And we seemingly all take a look no matter what. Individual investors, large institutional portfolio managers, and everyone in between are likely pleased to see one of their stocks get an upgraded rating or a new analyst cover the company.
Investor interest can generate more analyst coverage. This helps explain why analysts jump on young, much-hyped and talked about tech companies. Then, as new coverage is initiated, the company and the stock become more visible, which in turn often leads to more demand potential and therefore the possibility of higher prices.
Plus, analysts almost always initiate coverage with a positive recommendation. And the logic follows because why spend all the time and write a research report on a company not widely tracked only to say it’s not good?
When it comes to companies with little to no analyst coverage, one new recommendation can sometimes give portfolio managers the validation they need to build a position. And the more money they can invest, the more they can potentially influence prices.
The best way to use this information is to search for companies with analyst coverage that has increased over the last 4 weeks. We just look at the number of analyst recommendations today and compare it to the number of analyst recommendations 4 weeks ago.
The rule of thumb here is that an increase in coverage leans bullish and a decrease signals bearish behavior. It is also worth pointing out that, in general, the change in the average broker recommendation is a better indicator than the actual recommendation itself.
On top of that, it is typically more bullish if the increase went from none to one or if the coverage was minimal to begin with. (As the number of analysts climbs the addition of new coverage isn’t earth-shattering.) In the end, increased coverage is still better than decreased coverage, unless the coverage is heading in the wrong direction.
Now let’s try this screen…
• Number of Broker Ratings now greater than the Number of Broker Ratings four weeks ago
(This shows stocks where new coverage has recently been added.)
• Average Broker Rating less than Average Broker Rating four weeks ago
(By 'less than', we mean 'better than' four weeks ago.)
• Prices greater than or equal to 5
(We’re applying all of the above parameters to stocks above $5 a share since many money managers won't even look at stocks under $5)
• Average Daily Volume greater than or equal to 100,000 shares
(If there's not enough volume, even individual investors won't want it).
Here is one of the three stocks that came through the screen today…
MSA Safety Incorporated (MSA) - (from 2 analysts four weeks ago to 3)
MSA Safety Incorporated, as its name suggests, is a global safety equipment and solutions provider. The company boasts that its products “integrate a combination of electronics, software, mechanical systems and advanced materials to protect users against hazardous or life-threatening situations.”
MSA Safety’s wide range of equipment and gear services industries such as fire protection, construction, oil and gas, utilities, and more. MSA Safety’s offerings span from self-contained breathing apparatus and portable gas detection to helmets, fall protection, and beyond.
MSA Safety’s revenue growth over the last decade-plus is rather impressive. The safety equipment company topped our Q2 earnings and revenue estimates at the end of July and boosted its guidance.
MSA Safety’s FY23 earnings outlook has jumped 9% since its release, with its FY24 consensus now 7% higher to help it land a Zacks Rank #1 (Strong Buy) right now.
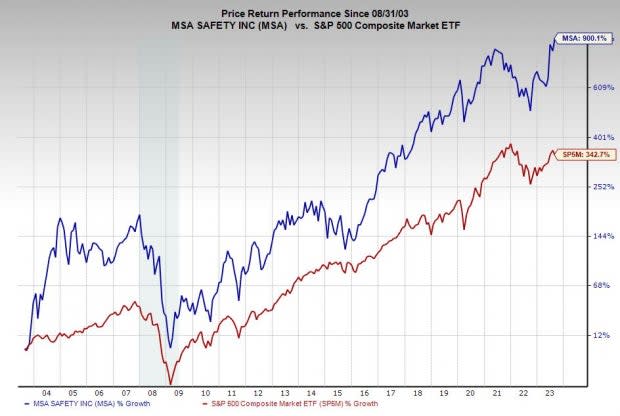
Image Source: Zacks Investment Research
Zacks estimates call for its revenue to climb 12% this year and another 5.5% higher next year to reach $1.81 billion to help boost its adjusted earnings by 16% and 10%, respectively. MSA Safety has also managed to top our EPS estimates by 21% in the trailing four quarters. And its dividend yields 1% at the moment.
MSA stock has soared 50% in the last year, including a 28% climb in the last three months to trade near fresh highs. The current stretch is part of MSA Safety’s 275% run over the past decade to crush the S&P 500’s 167% and the Zacks Industrial Products sectors’ 55%.
Even though MSA stock is trading right near new records, it trades at a 27% discount to its own decade-long highs at 25.8X forward 12-month earnings.
Many screeners won't let you search for the number of analysts covering a stock, let alone comparing the amount of coverage they had weeks or even months ago. But you can with the Research Wizard. And you can backtest it all. Find out how to pick the right stocks right now by taking a free trial to the Research Wizard stock picking and backtesting program.
Click here to sign up for a free trial to the Research Wizard today.
Want more articles from this author? Scroll up to the top of this article and click the FOLLOW AUTHOR button to get an email each time a new article is published.
Disclosure: Officers, directors and/or employees of Zacks Investment Research may own or have sold short securities and/or hold long and/or short positions in options that are mentioned in this material. An affiliated investment advisory firm may own or have sold short securities and/or hold long and/or short positions in options that are mentioned in this material.
Disclosure: Performance information for Zacks’ portfolios and strategies are available at: https://www.zacks.com/performance.
Want the latest recommendations from Zacks Investment Research? Today, you can download 7 Best Stocks for the Next 30 Days. Click to get this free report
MSA Safety Incorporporated (MSA) : Free Stock Analysis Report
